What 5,197 Job Postings Reveal About AppSec Hiring


We analyzed 5,197 application security job postings across 796 companies, October 2025 through May 2026. A subset of 636 postings with full job description text was classified by an LLM into pain signals, role characteristics, and AI-readiness indicators. Three findings define the market.
1. The Remediation Gap. 78.6% of AppSec roles describe vulnerability fixing as human coordination work. The 3:1 detection-to-remediation mention ratio reveals an industry that has invested heavily in finding problems but hasn't automated the fixes. Only 3.3% use narrow remediation terms like "remediation velocity," "fix rate," or "triage backlog." But 41.5% use explicit remediation language, and 78.6% signal remediation work once coordination language is included. The finding is not that companies never name remediation. It is that most remediation work is still described as human handoff: "partner with engineering teams," "collaborate with developers," and "drive corrective actions."
2. The Seniority Lockout. 49.6% of roles require Senior-level experience or above. Just 1.9% are open to entry-level candidates. The talent pipeline is self-depleting. Combined with a 13:1 IC-to-leadership ratio, AppSec is a hands-on-keyboard discipline with almost no development path for new practitioners.
3. AI Security: Real but Early. 20.8% of enriched job descriptions mention AI, with a 3.4x acceleration in AI keyword prevalence (from 2.1% in November 2025 to 7.2% in May 2026). 38 jobs reference agentic security concepts. AI-mentioning roles command a 10.9% salary premium. The discipline is real. 4 in 5 AppSec job descriptions in this sample have not yet incorporated it.
Key benchmark: Enterprise companies post approximately 2 AppSec roles per 1,000 engineers. Mid-Market: approximately 8 per 1,000.
Methodology, dataset boundaries, and the six known biases are documented at the end of this report.
The Remediation Gap
This is the structural finding of the report. If you read nothing else, read this: companies have automated detection. They have not automated remediation. Every other gap in this dataset, from the seniority lockout to the talent shortage, traces back here.
The 78.6% Finding
78.6% of the 636 enriched job descriptions describe vulnerability remediation as work that requires humans coordinating with other humans.
That number comes from semantic analysis, not keyword matching. When we searched for narrow remediation vocabulary ("remediation velocity," "fix rate," "triage backlog"), only 3.3% of job descriptions contained those terms (21 of 636). The semantic approach captured what keyword analysis missed: the majority of remediation work is described using coordination language that never names the work directly.
The explicit-implicit breakdown reveals the structure of the gap:
The implicit remediation category is the critical finding. These 429 job descriptions describe remediation work using language like:
• "Partner with engineering teams to address findings"
• "Collaborate with developers to resolve vulnerabilities"
• "Work cross-functionally to ensure timely fix implementation"
• "Drive and manage execution of corrective actions to address deficiencies"
The classification confidence on these implicit labels is 75% high, 18% medium, 7% low. Read the 78.6% figure as "remediation language present at any confidence level." The narrower claim, explicit remediation vocabulary in a job description, sits at 41.5%.

The 3:1 Detection-to-Remediation Mention Ratio
71% of job descriptions reference scanning tools. Only 24% reference remediation workflows. That is a 3:1 detection-to-remediation mention ratio.
For every job that mentions fix workflows, three mention scanners. The industry has automated finding problems. It is still hiring humans to figure out what happens after the scanner runs.
Companies have invested heavily in finding vulnerabilities. The data shows they are still hiring people to translate scanner output into developer action.
This ratio holds across company sizes. It is likely sharper in Financial Services, where scanner adoption is near-universal and remediation requires change advisory board approval. Institutional friction sits between detection and fix.
The SLA Blackout
Among 62 companies whose public-facing security pages, compliance documentation, and career portals we reviewed, only 2 had published vulnerability remediation SLAs: Clio and JFrog. That is 3%.
The rest have no public commitment to fix timelines. Internal SLAs may exist; this method would not capture them.
Defense & Space is the contrast. The sector shows 23.8% explicit remediation vocabulary in job descriptions. NIST and CMMC mandates require documented fix timelines. The language follows the mandate.
Mandates change the language. When fix timelines become contractual, remediation stops hiding inside coordination language and starts becoming named work. Defense & Space may preview what commercial AppSec language looks like if fix-SLA pressure becomes more common.
If the industry had automated remediation at scale, we would expect to see fix SLAs becoming standard. We would expect to see remediation tool vendors named in job descriptions. We would expect to see fewer roles dedicated to the human coordination loop between scanners and developers.
We see none of those things.
The Pain Landscape
We classified all 636 enriched jobs across 8 pain categories:
The pain landscape confirms the same pattern from another angle: developer friction (59.9%), tool sprawl (55.5%), and false positive burden (22.6% direct mentions) are all symptoms of the same handoff problem. AppSec teams are still translating scanner output into developer action by hand. The operational cost of that handoff is the subject of our false-positive triage automation framework.

The remediation gap is not a vocabulary problem. It is a structural one. Detection runs at machine speed. Remediation runs at human speed. Every other finding in this report is a downstream consequence of that one fact.
The Seniority Lockout
The remediation gap describes the work. The seniority lockout describes who is allowed to do it. These two findings are the same problem viewed from opposite sides: the work requires senior engineers because nothing has been automated, and seniors are scarce because nobody is investing in the pipeline that would produce them.
The Pyramid
Across all 5,197 job postings, the seniority distribution is top-heavy:
49.6% of all roles require Senior-level experience or above (Senior/Lead through Principal/Distinguished). Just 1.9% are open to junior or associate-level candidates. That is 97 entry-level roles across 5,197 postings.
1.9%. For every junior AppSec role posted in this dataset, there are 19 Senior-level roles, 4 Staff roles, and 3 Principal roles competing for attention in the same talent market.
The IC-to-leadership ratio is 13:1. Individual contributors (Junior through Principal) account for 4,838 roles (93.1%) versus 358 management and leadership roles (6.9%). AppSec is a hands-on-keyboard discipline, overwhelmingly.
A caveat: the "Mid-Level (Unspecified)" category at 39.8% deserves scrutiny. Seniority was inferred from job titles, and many postings simply read "Application Security Engineer" without an explicit level. Some of these roles may accept strong junior candidates in practice, even if the posting doesn't signal it. But the majority list 3-5+ years of required experience in the job description body.

The Self-Inflicted Talent Shortage
For every junior role posted, there are roughly 19 Senior-level roles, 4 Staff roles, and 3 Principal roles competing for attention in the same talent market. The industry is trying to hire experienced practitioners at an extraordinary rate while investing almost nothing in creating them.
The investment signals confirm this:
• Only 5% of enriched job descriptions mention Security Champions programs
• Only 15% reference developer security education initiatives
• 72% use shift-left language
Companies articulate a sophisticated vision for how AppSec should operate: enablement-focused, developer-partnered, remediation-oriented. Then they post requirements only filled by people with 5-10 years of experience doing exactly that work somewhere else.
Security Champions programs train developers and embed them as security advocates. They build the path from developer to security-aware developer to security engineer. Only 1 in 20 postings mentions the concept.
The engineering identity shift compounds the problem. With 60.6% of roles scoring 4 or 5 on engineering nativeness, a junior candidate now needs foundational security knowledge and meaningful software engineering ability: production-quality Python, Terraform modules, CI/CD pipeline automation. The traditional on-ramp from penetration testing or compliance auditing still exists. It is no longer sufficient on its own.
Every company is competing for the same experienced talent. Nobody is investing in junior practitioners. The shortage is self-inflicted. No hiring budget can fix a pipeline problem.
The scaling crisis compounds the deficit. 14.8% of enriched postings explicitly reference securing more applications, more repositories, more pipelines with the same or fewer people. Underwater teams hire for immediate contribution, not for 12-18 months of ramp. The urgency is rational. The consequence is a shrinking talent pool that makes the urgency worse.
The staffing implication is blunt: if companies want junior AppSec candidates, they have to design jobs that juniors can survive. That means reducing the routine triage burden, making mentorship explicit, and treating Security Champions as a feeder system rather than a maturity checkbox.
Benchmarks
We calculated AppSec hiring intensity per 1,000 engineers across 796 companies:
Enterprise companies have proportionally small AppSec teams relative to their engineering workforce: one AppSec posting per approximately 900 engineers at the aggregate rate. Mid-Market companies invest proportionally more, building teams from scratch. The SMB number is inflated by security-focused vendors and tiny engineering teams; median is more reliable than mean.
Hiring intensity also varies sharply by industry:
These benchmarks represent hiring intent, not current team size. But they give every CISO a defensible comparison point for headcount conversations.
Compensation Context
Salary disclosure is low at 5.3% (274 of 5,197 postings), and the companies that disclose skew toward states with pay-transparency laws (Colorado, California, New York, Washington), which introduces geographic bias. With that caveat, the disclosed ranges reinforce the seniority lockout:
The broadest honest statement: disclosed AppSec compensation ranges from $69,400 (endpoint security, McLean, VA) to $326,060 (Senior Security Software Engineer, San Mateo, CA), with a median range estimate of $130,000 to $210,000. Notable data points include a Staff Product Security Engineer at Credit Karma ($207K-$280K) and a Security GRC Engineer in New York ($200K-$250K); the GRC premium reflects the compliance pressure that appears in 45.4% of enriched job descriptions.
If you are staffing an AppSec team, budget for competitive senior compensation or budget for longer time-to-fill.

The talent shortage is self-inflicted. No hiring budget can fix a pipeline that nobody is replenishing. 5% of postings mention Security Champions. 15% mention developer education. 1.9% are open to junior candidates. Three numbers that describe one strategic choice: every company is hoping someone else trains the next generation.
The Shift-Left Mirage
The previous chapter described who is allowed to do the work. This one describes the philosophy companies say they operate by. Shift-left and enablement are the dominant narratives in 2026 AppSec hiring. They are also the widest gaps between what companies say and what they fund. The headline numbers measure language, not maturity. The language does real damage: it gives boards and CISOs a story of progress the structural data does not support.
Aspiration vs. Implementation
The gap between what AppSec teams say and what they do is the most consistent finding in this dataset.
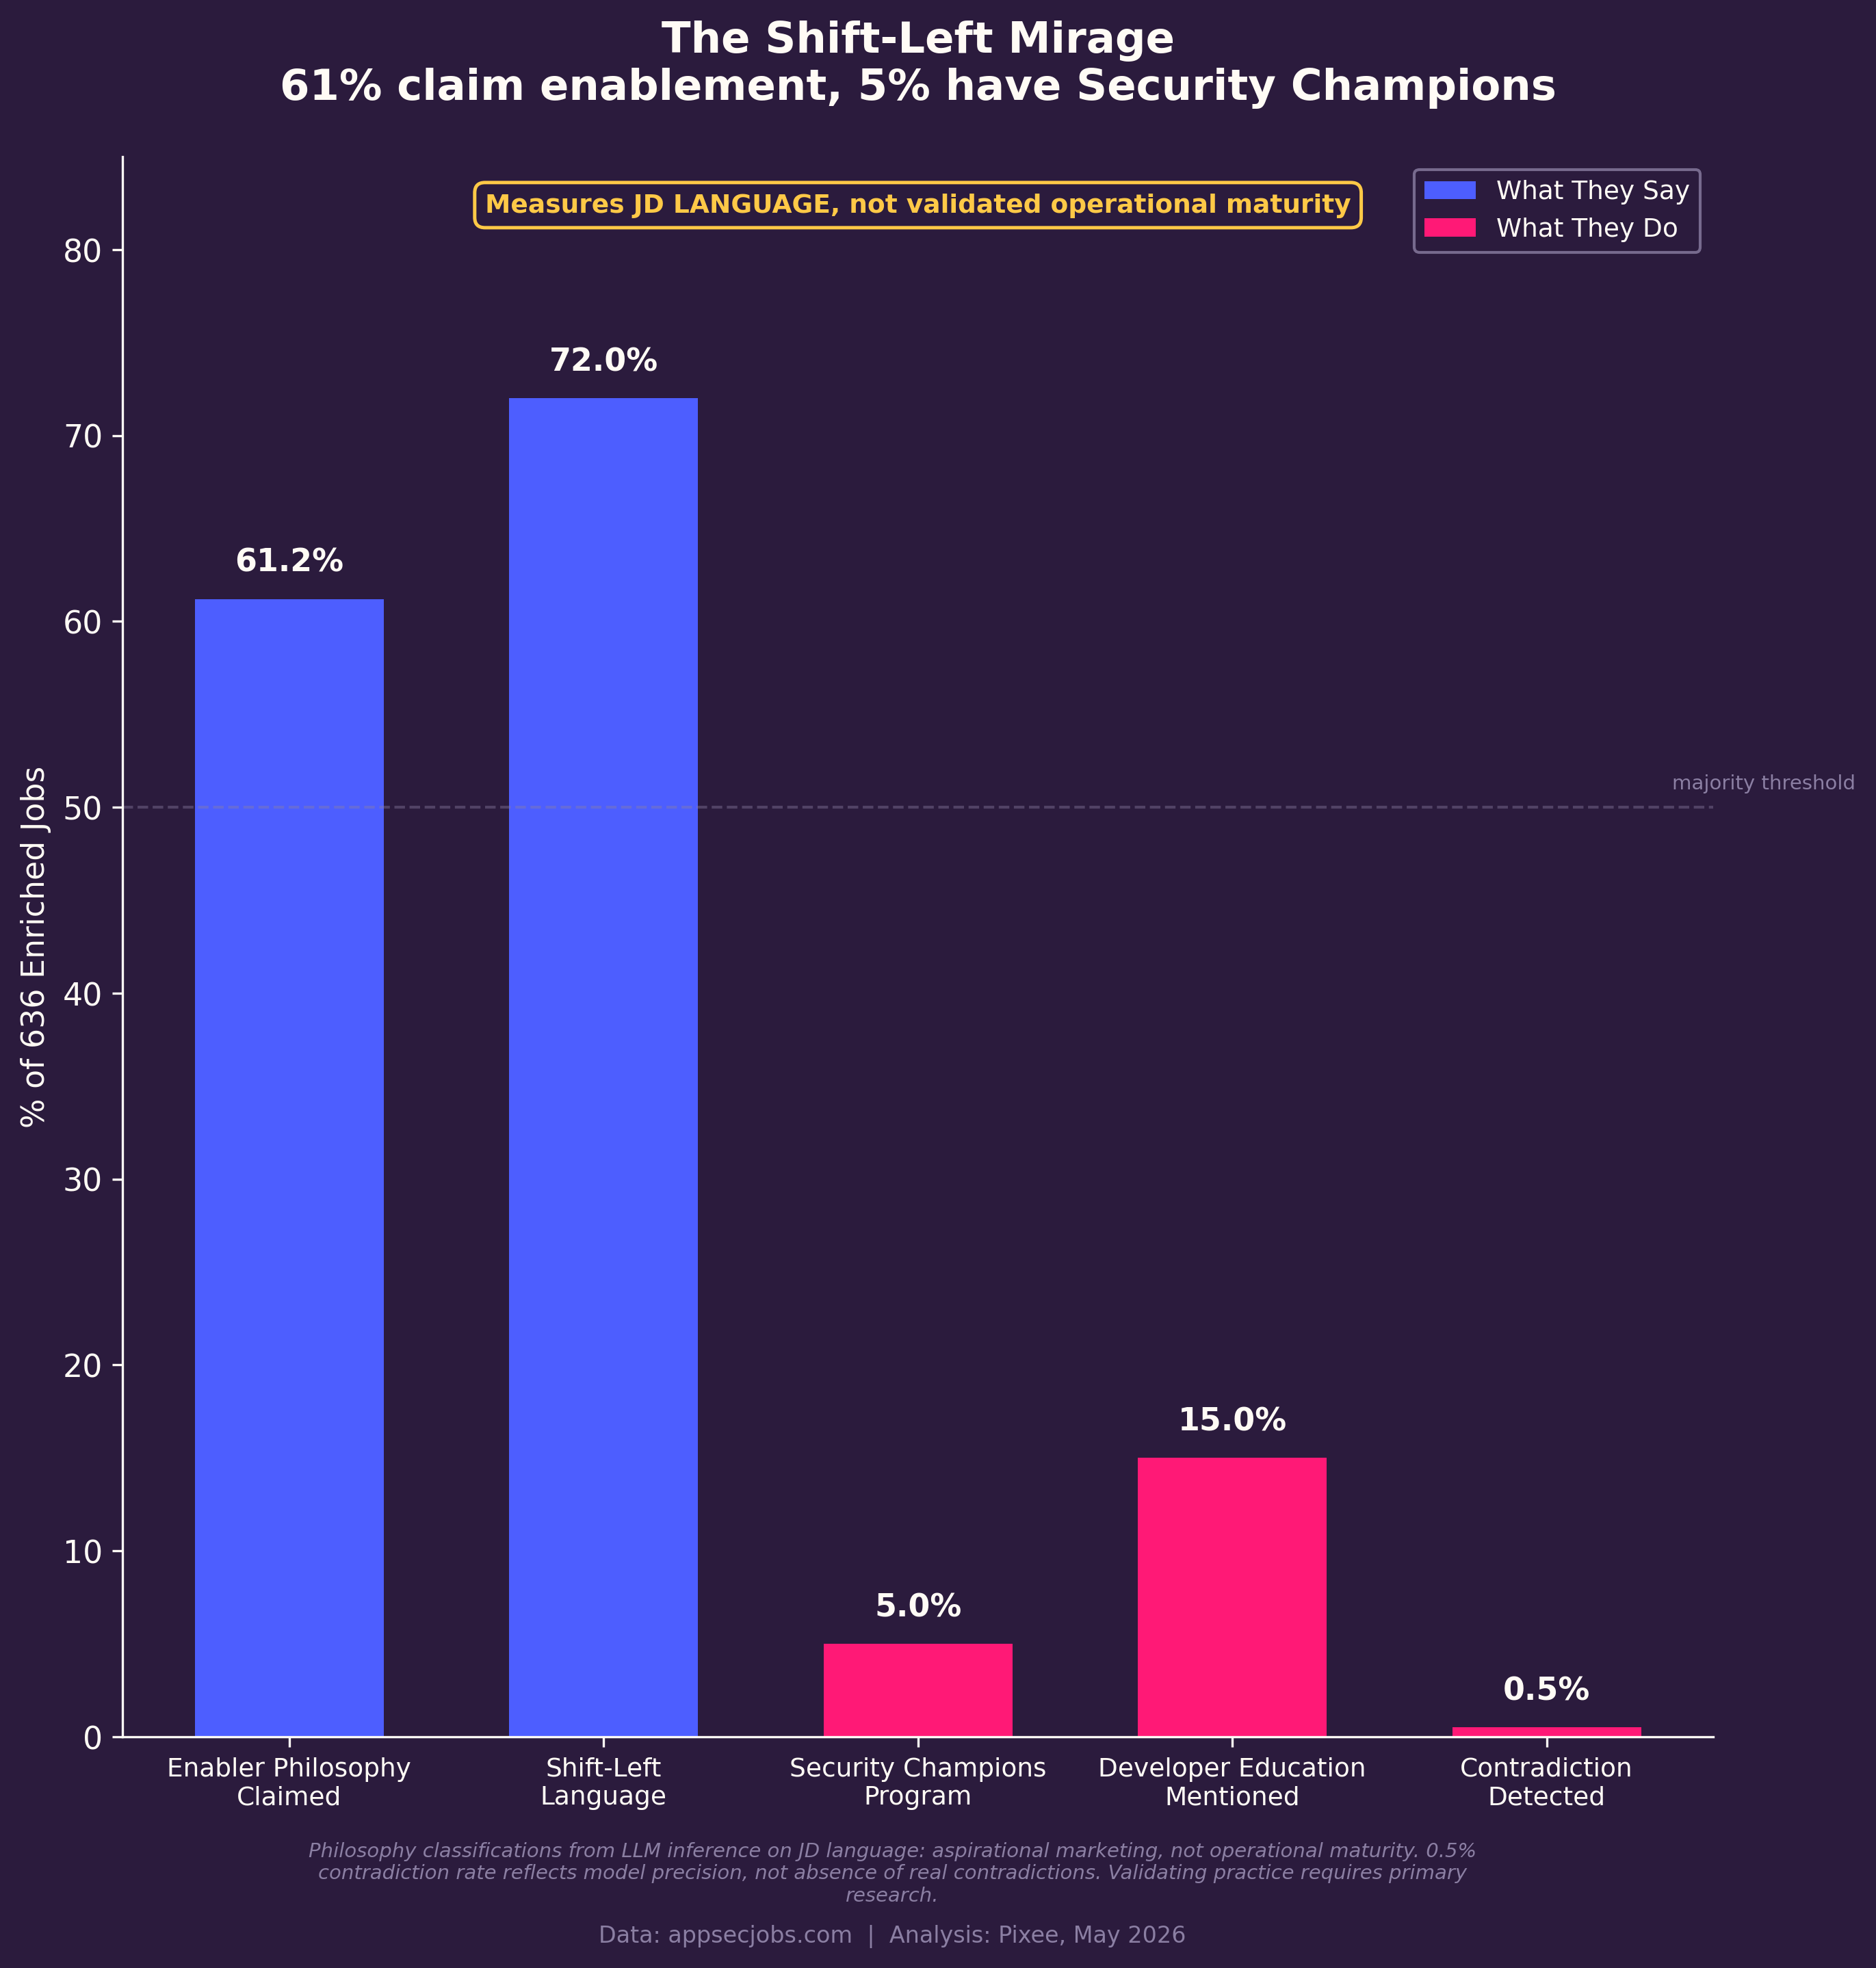
72% of enriched job descriptions use shift-left language. 61.2% describe an Enabler philosophy: empowering developers rather than gatekeeping them. The industry has clearly settled on what AppSec should look like.
Both figures measure language, not maturity. Job descriptions are marketing documents. A posting that says "shift-left" does not prove the team practices shift-left. A posting that says "enabler" does not prove the team avoids gatekeeping behaviors. The 72% and 61.2% are best read as vocabulary of modern AppSec, not operational proof.
But implementation signals tell a different story:
33.5% of AppSec teams remain centralized, operating as a separate group serving the entire organization. This is the most common structure even among companies that describe themselves as enablement-focused. The structural model contradicts the philosophical claim.
Roughly 15% of postings describe themselves as enablers but contain gatekeeper behaviors in the actual requirements: mandatory sign-offs, blocking deployment gates, compliance checklists. The aspiration says "enabler." The job description says "you will approve or reject releases." Whether that is intentional hybrid design or organizational cognitive dissonance varies by company.
The say-do gap is the industry norm, not the exception. That is not exoneration. It is the explanation for why detection metrics keep improving while breach rates do not.
Build vs. Buy and Tool Sprawl
Build vs. buy orientation averaged 2.80/5 (median 3). The lean is toward buying over building, consistent with the tool sprawl signal.
55.5% of enriched roles acknowledge managing multiple scanning tools. We cataloged 80+ security vendors across the dataset. There is no dominant player in any category. The fragmentation creates operational overhead: every tool has its own configuration, its own false positive profile, its own integration requirements.
The combination of tool sprawl (55.5%) and developer friction (59.9%) creates a compounding problem. More tools means more findings. More findings means more coordination with developers. More coordination means more senior AppSec engineers needed to manage the handoffs. The tooling strategy is inseparable from the staffing problem.
Only Defense & Space shows consistent alignment between aspiration and implementation. NIST, CMMC, and FedRAMP mandates carry contractual consequences. When fix timelines become contractual, the say-do gap narrows. This may preview where commercial compliance is heading.
Aspiration is universal. Implementation is rare. The companies that close the say-do gap first will have an operational story their boards can defend. The companies that don't will keep funding the vocabulary of modern AppSec without the substance, and the next compliance audit or breach will surface the difference.
AI Security Emergence
Shift-left isn't the only language gap in 2026 AppSec hiring. AI security is the most-asked-about hiring trend of the year and the most-overstated one. The headlines say AI is rewriting security. The hiring data says 1 in 5 enriched AppSec job descriptions even mention it, and the steepest growth is concentrated in 38 frontier roles at a handful of named companies. This chapter is for CISOs who need to separate the genuine emerging discipline from the buzzword inflation.
Prevalence and Trajectory
132 of 636 enriched AppSec job descriptions mention AI, ML, or LLM. That is 20.8%.
Which means 79.2% don't.
If you're a CISO reading headlines about AI rewriting security, the hiring data is a corrective. AI security is a genuine emerging discipline with real budget behind it. It is not yet a market-wide shift.
The trajectory matters more than the current percentage. AI keyword prevalence has accelerated 3.4x, from 2.1% in November 2025 to 7.2% in May 2026. At the census level, 85 jobs (1.6% of all 5,197 postings) carry AI, ML, GenAI, or Agentic directly in the title. These are roles where AI isn't a line item in the requirements. It is the identity of the position.
3.4x growth in six months. AI keyword prevalence in AppSec job postings tripled between November 2025 and May 2026. The discipline is real. The hiring volume is small. Both are true at once.

Four Framings: Tool vs. Role vs. Threat vs. Buzzword
Not all AI mentions are equal. We classified every AI reference across the 132 job descriptions into four categories based on how companies actually use the term:
The dominant framing is Tool, not Threat. Companies see AI as something to build with, not something to defend against.
Specificity tells a sharper story. Among all AI-mentioning jobs:
If a job description names specific platforms, the company probably knows what it wants. If it says "AI/ML a plus," treat that as aspirational at best.

The Agentic Frontier
38 jobs (28.8% of AI-mentioning roles) reference agentic security concepts: autonomous remediation workflows, multi-step AI investigation, MCP servers, and agent-to-agent communication.
Our classifier identified "agentic" patterns from job description language rather than requiring an explicit "agentic" keyword. Overall AI specificity in the parent set splits 39.4% high / 29.5% medium / 31.1% low; the specificity distribution of the agentic subset is not separately reported. Treat the 38 figure as a directional signal of where the frontier is forming, not a precise count of deployed agentic security programs.
Six months ago, "agentic security" was not a job requirement anywhere in this dataset. Now companies like HPE, Zendesk, Wells Fargo, Deloitte, and Keysight are writing it into postings. Zendesk's Director-level job description is the most specific we found, explicitly naming "MCP Server, A2A flows, agentic actions" as core responsibilities.
The agentic category blends three hiring needs: securing agentic AI products, governing internal agentic workflows, and using agentic tools inside AppSec itself. The market has not settled on which one "agentic security engineer" means, and the job descriptions reflect that ambiguity.
38 jobs across 5,197 total postings is a fraction. But the companies writing these job descriptions today are building institutional knowledge that will be hard to replicate once the market catches up.
38 agentic security jobs. That is the entire frontier visible in this dataset. The companies writing those job descriptions today (HPE, Zendesk, Wells Fargo, Deloitte, Keysight, and a handful of others) are setting the operational definition of "agentic security" before the rest of the market arrives.
The Metadata-JD Alignment Observation
One earlier finding deserves recasting. We previously framed it as an "Awareness-Action Gap." That framing overclaims.
The observation: 85 companies in the dataset have AI mentioned in their company-level metadata (drawn from public materials, press, and product announcements) but do not mention AI anywhere in their posted AppSec job descriptions.
This is an alignment observation, not a readiness verdict. Sequential prioritization, functional separation, and broad corporate metadata can all explain the gap without proving negligence. But if a company is shipping LLM-powered features and its AppSec hiring language says nothing about AI, the disconnect deserves executive attention.
If your product is changing faster than your AppSec role design, the risk is not semantic. It is the gap between what your product does and what your security organization is staffed to defend. The hidden tax of AI coding tools widens that gap faster than most teams track it.
The Compensation Premium
AI-mentioning AppSec roles command a 10.9% salary premium: $155,936 average compared to $140,648 for traditional AppSec positions.
The premium deserves context. Salary disclosure rates are low (5.3%); the numbers come from a small sample. They reflect disclosed compensation, not total comp with equity and bonuses. The premium may partly reflect seniority rather than AI skills alone. AI-mentioning roles skew toward senior and principal levels.
The top of the range tells its own story:
• $374K: Zendesk, Director of AI Security
• $333K: BetterUp, Principal AI Security Engineer
When a company pays $374K for an AI security director, it is building a program, not filling a checkbox.

AI security is visible but early. 20.8% of enriched job descriptions mention AI; 1.6% of all postings carry AI in the title. The frontier is 38 agentic-pattern roles at named companies. Four in five enriched postings still say nothing about AI. Most AppSec hiring has not yet operationalized the shift in job-description language. For companies shipping AI features, that silence is worth investigating, not condemning.
The Role Taxonomy
The first four chapters describe gaps: remediation, seniority, philosophy, AI. This chapter steps back from any single gap and asks what shape the AppSec role itself has taken in 2026. The taxonomy reveals a discipline that has moved decisively into engineering, even where the job titles haven't caught up.
Role Families (Census View)
Across all 5,197 postings, title-based classification reveals the following distribution:
"Security Engineer (General)" is the largest single bucket at 28.8%. Many companies have stopped using the "Application" qualifier. Whether that reflects a genuine broadening of scope or shifting title conventions is an open question.
DevSecOps as a title is fading at 3.4%, but the work persists: DevSecOps Pipeline Owner appears as a job-to-be-done in 9.3% of enriched roles, nearly three times the title frequency. The title is consolidating into broader engineering roles.
AI Security at 1.6% (85 roles) is a genuinely new category that didn't exist in AppSec postings two years ago.
The 17.5% "Other" category is large. It contains everything from "Trust and Safety Engineer" to "Security Consultant" to roles that resist clean taxonomy. When nearly one in five roles doesn't fit neatly into established categories, the categories themselves deserve scrutiny.

Jobs-To-Be-Done (Enriched View)
Job titles and job content are different things. LLM-based classification of the 636 enriched postings identifies the core jobs-to-be-done described in each listing:
The AppSec Generalist is still the plurality at 33%, but it is a third of the field, not a majority. Two-thirds of JTBD are specialized. Product Security Integration (16.4%) is the specialization worth watching: it shows up as 12.6% of titles but 16.4% of JTBD, meaning some roles titled "Application Security Engineer" or "Security Engineer" are functionally product security roles.
Vulnerability Management Specialist (6.3%) is a distinct specialization focused entirely on the backlog: triaging, prioritizing, tracking, and sometimes closing findings. That this is its own job-to-be-done, separate from the teams running the scanners, says something about how many organizations operate. One group finds issues. Another group figures out what to do. A third group (developers) is supposed to actually fix them. We unpack the operational cost of that split in the security backlog playbook.

Philosophy, Engineering Identity, and Team Structure
We scored each enriched posting on multiple dimensions of organizational character:
Security philosophy:
Engineering nativeness (scored 1-5, where 1=GRC-rooted, 5=software engineering-rooted):
Median is 4; 60.6% of roles score 4 or 5. This is a custom scale and should not be compared to external benchmarks, but it aligns with the rest of the evidence. Product Security appears more often in the work than in the title. DevSecOps is fading as a title but persists as a job-to-be-done. Python, CI/CD, Terraform, Kubernetes, SAST, DAST, SCA, and threat modeling dominate the skill profile. Taken together, the pattern is clear: AppSec hiring is moving toward security engineering, even when the taxonomy still says "Application Security Engineer."
Team structure:
Centralized teams remain the most common model, but only by a slim margin over embedded teams. Hub-and-spoke, where a central team places members in critical product areas, is the compromise model at 20.9%.
Team structure changes the job. Centralized roles lean toward tooling, policy, and assessments. Embedded roles lean toward design review, code contribution, and feature-level threat modeling. Hub-and-spoke tries to do both.
Communication skills are the most frequently mentioned requirement overall. The security-specific skills describe a role that is part software engineer, part security expert, part organizational translator.
The role taxonomy is lagging the work. Companies still post familiar AppSec titles, but the job underneath is increasingly product security, automation, pipeline ownership, and developer enablement. The label has not caught up to the labor.
Market Map: Who's Hiring and Where
High-Volume Hiring Signals
The top 15 companies by posting volume account for a substantial share of the dataset:
New entrants since Q1 include Anduril (first seen February 2026), Anthropic, Cloudflare, Stripe, xAI, Brex, 1Password, State Street, Airwallex, and TD Bank. Over 430 companies are new to the dataset since Q1. The new-entrant list tells its own story about market expansion: defense technology, AI-native companies, infrastructure, fintech, and traditional financial institutions are all investing in dedicated AppSec capacity.
The backfill signal tells a secondary story. Posting status reveals whether companies are actively building or cycling through positions:
Companies with high "still active" rates are mid-build-out. Companies with high "taken down" rates either filled rapidly or cycled through requirements. Both patterns are informative for benchmarking.
Industry Distribution (census, 5,197 postings)
IT & Services dominates at 42.9% of all postings. Financial Services is the second-largest vertical at 7.9% (11.1% combined with Banking and Insurance).
The Healthcare paradox. The industry handles the most sensitive data of any sector yet posts the fewest AppSec roles per company on this board (3.6, vs Financial Services 5.3, Defense & Space 7.5, IT & Services 8.4). Whatever explains that gap, "we are well-staffed for the risk we hold" is not it.
Aviation & Aerospace shows the highest per-company intensity at 8.9 roles, driven substantially by SpaceX (42 of 62 roles).
Geographic Distribution
Bengaluru has more AppSec job postings than any single US metro. India accounts for approximately 453 jobs (8.7% of all postings), combining Bengaluru (307 including Bengaluru East), Hyderabad (60), Chennai (34), Pune (25), and other locations.
But the roles differ in kind, not just location. US postings emphasize strategy, architecture, and program leadership. India postings concentrate in operational AppSec: scanning, triage, and compliance execution. Same titles, different jobs.
Within the US, security hiring is no longer Bay Area-dominated. San Francisco Bay Area (115 combined), New York (75), Austin (70), Washington DC (64), and Seattle (53) represent a distributed landscape. Charlotte, NC (49 postings) has emerged as a financial-services secondary hub, driven by Bank of America and Wells Fargo operational security centers.
Financial-services AppSec hiring clusters in New York/New Jersey (banking and insurance HQs), Charlotte (bank operations), Bengaluru/Hyderabad (offshore operational security), Toronto (Canadian banking), and London (European financial hub).

Work Arrangement
Among the 490 postings with classified work-type data (under 10% of the total, the least-reliable dimension in the dataset):
Among companies that bother to specify, hybrid is the dominant model and fully remote roles are the minority. For work that is overwhelmingly engineering and tooling, AppSec skews more on-site than the broader software-engineering market.
Where Automation Changes the Equation
The preceding chapters mapped the gap. This one describes what closing it looks like, and which structural pressures are easiest to relieve. The argument is not about any vendor or tool category. It is about which AppSec staffing model is sustainable when remediation work is automatable, and which is not.
The Structural Problem
The data in this report describes a market finding vulnerabilities at machine speed and fixing them at human speed.
Three structural gaps compound one another:
1. The remediation gap. 78.6% of AppSec roles describe remediation as human coordination work. The 3:1 detection-to-remediation mention ratio shows where investment has gone (detection) and where it hasn't (fixing). Only 3% of reviewed companies publish fix SLAs.
2. The talent gap. 49.6% of roles require Senior+ experience. 1.9% are open to entry-level. With only 5% of postings mentioning Security Champions and 15% mentioning developer education, the pipeline isn't being replenished.
3. The tooling gap. 55.5% of roles reference managing multiple security tools. 80+ vendors, no dominant player. Tool sprawl creates more findings, which creates more coordination work, which requires more senior engineers: the same engineers everyone else is trying to hire.
These are not independent problems. They are a self-reinforcing cycle. More scanning tools generate more findings. More findings require more human coordination for remediation. Remediation work requires experienced practitioners. Experienced practitioners are scarce. The response is to buy more tools, which generates more findings.
What Closing the Gap Looks Like
The hiring data doesn't prescribe solutions, but it does reveal where the pressure is greatest:
• Automated triage reducing false positive burden. 22.6% of roles cite false positive management as a significant pain. Every false positive consumed by a senior AppSec engineer is time not spent on real vulnerabilities or mentoring junior team members.
• Automated remediation reducing the human coordination loop. 78.6% of roles describe remediation as coordination work. Tooling that can generate fixes that are context-aware, match existing code conventions, and integrate into developer workflows reduces the dependency on senior engineers as the fix delivery mechanism.
• Developer-native tooling addressing friction. 59.9% of roles exist at least partly to bridge the gap between security tools and engineering teams. Tools that deliver fixes directly to developers in their existing workflows reduce the coordination overhead that defines most AppSec roles today.
The data does not prove which operating model wins. It shows where the current one breaks: scanners scale faster than human coordination. Companies that reduce that coordination load, through automation, process redesign, or both, change the staffing math. Senior AppSec time can move away from triage brokerage and toward architecture, governance, and mentoring. Junior roles become easier to support when the entry-level workload is not an unmanaged backlog. The architectural response to that backlog is the subject of our Burndown to Zero playbook.
The remediation gap is a staffing-model problem as much as a tooling problem. If finding vulnerabilities keeps scaling faster than fixing them, AppSec teams will keep paying senior engineers to broker handoffs between scanners and developers. The strategic question for 2026 is not whether companies can find more vulnerabilities. It is whether they can change the economics of fixing them.
Methodology and Limitations
How to Read This Report
Two denominators recur throughout: census-level (5,197 postings) for aggregate counts like seniority distribution, role families, geography, industry, and compensation; enriched subset (636 postings with full JD text) for semantic analysis like pain signals, remediation gap, role philosophy, engineering nativeness, AI framing. Unless explicitly marked "census," percentages are from the 636-enriched subset.
Job descriptions are marketing documents. They describe the ideal, not the actual. A posting that says "shift-left" doesn't prove the team practices shift-left. We note this distinction throughout because it matters for every claim in this report. Every finding here comes from one specialized AppSec job board; security-adjacent roles posted on general boards (LinkedIn, Indeed, internal ATS) are not in this sample. Read every percentage with the prefix "on this board."
Data Source, Scope, and Completeness
Source: appsecjobs.com, a specialized aggregator for application security, product security, and DevSecOps positions. Collection ran from October 2025 through May 2026 and produced 5,197 postings across 796 companies, with 636 full job descriptions available for enrichment.
Approximately 48.5% of records have NULL values across description, skills, salary, responsibilities, and work type. Company-level fields have 91-92% coverage. The observed duplicate rate among enriched jobs is 44.3%.
LLM Classification Methodology
All semantic classification was performed using Claude Haiku 4.5 in sub-batches of 10 across three analysis layers:
Layer A, Pain Extraction: 8 boolean pain categories (remediation explicit, remediation implicit, developer friction, tool sprawl, scaling crisis, false positive burden, compliance pressure, shift-left aspiration) plus confidence scoring. Remediation implicit includes evidence quotes from the source text.
Layer B, Role Character Analysis: 6 classification dimensions: job-to-be-done, security philosophy, philosophy-behavior contradiction, team structure, build vs. buy orientation, and engineering nativeness (1-5 scale).
Layer C, GenAI Deep Dive: 132 JD-match jobs fully classified for AI framing (Tool/Role/Threat/Buzzword), specificity (High/Medium/Low), agentic detection, specific technologies, and key quotes. 85 metadata-only AI jobs received light classification.
Confidence distribution: 75% high, 18% medium, 7% low. All findings aggregate across confidence levels.
Quality Gate and Known Biases
An independent review assessed all findings for ratio fallacies, denominator errors, and overclaims: 13 findings were confirmed as-is, 15 received caveats, and 0 were retracted.
The largest biases are JD aspiration, single-platform coverage, recruiter inflation, posting volume spikes, and duplicate listings. The most important caveats: shift-left and enabler figures measure language rather than confirmed maturity; AI prevalence and agentic-security counts are meaningful patterns rather than statistically robust samples; segment-level comparisons should not be treated as equally representative across Enterprise, Mid-Market, and SMB cohorts.
Statistical Rigor
No statistical significance testing is applied. The dataset is not a probability sample of a larger population; it is a near-census of one platform's listings. Sample-level claims are qualified as "in this sample," not "in the market." Census-level claims cover all 5,197 jobs but are limited by field completeness.
Industry Snapshots
Healthcare
23 companies, 82 roles, 3.6 roles per company, 1.6% of total. Healthcare handles the most sensitive data of any industry yet posts the fewest AppSec roles per company on this board. Compliance pressure (HIPAA, HITRUST, FDA cybersecurity requirements) is the dominant hiring driver, and roles emphasize operational AppSec (scanning, triage, compliance execution) over program architecture. Medical-device security is a growing sub-specialty driven by FDA pre-market guidance. The detection-to-remediation gap is compounded by change-management requirements around patient-facing systems and legacy software with long patch cycles.
Financial Services (Including Banking and Insurance)
115 companies, 575 roles, 5.0 roles per company, 11.1% of total. The second-largest AppSec hiring vertical. PCI-DSS, SOC 2, and OCC/FDIC requirements drive hiring decisions. Tool sprawl is acute: large institutions run multiple scanning platforms across thousands of repositories, and remediation is manual and cross-functional, requiring change-advisory-board approvals that add friction between detection and fix. Competition for talent comes from fintechs (Stripe, Brex, Airwallex) offering modern stacks. Geographic concentration: New York, Charlotte, Bengaluru, Toronto, London.
Defense & Space
16 companies, 120 roles, 7.5 roles per company, 2.3% of total. The highest explicit remediation vocabulary of any industry at 23.8%, driven by NIST and CMMC mandates that require documented fix timelines. Anduril alone accounts for 81 of 120 postings, 99% already taken down. Security-clearance requirements severely constrain the talent pool, and air-gapped, classified environments limit cloud-based scanning tools, creating a distinct tooling landscape. The sector may preview where commercial compliance is heading as fix-SLA mandates spread.
IT & Services / SaaS
265 companies, 2,229 roles, 8.4 roles per company, 42.9% of total. Dominates volume. Tool sprawl is the defining challenge: 80+ security vendors cataloged with no dominant player. Enablement philosophy is strongest here, with SaaS companies leading in engineering-native security. AI-security hiring is also most visible in this sector (Zendesk, Anthropic, Databricks), and Product Security as a distinct function is most concentrated here. Compensation spans the widest range, from $90K at mid-level to $374K for AI-security leadership.
Close the Remediation Gap
This report describes a market that finds vulnerabilities at machine speed and fixes them at human speed. Pixee automates the work most AppSec job descriptions still describe as manual coordination: up to 95% false positive reduction in triage, and a 76% developer merge rate on automated fixes. Triage and remediation, in one platform, integrated with the scanners you already run.
See how Pixee closes the remediation gap
Get the full report
The complete State of AppSec Hiring 2026 — all findings, sector breakdowns, and full methodology — as a designed PDF. No form, no email required.
Download the PDF →About This Research
The State of AppSec Hiring 2026 is produced by Pixee Research. Data: appsecjobs.com, October 2025 through May 2026. To cite this report, attribute as "Pixee Research, The State of AppSec Hiring 2026, May 2026." Research collaborations: research@pixee.ai.