Vulnerability Remediation Statistics 2026: 15 Numbers That Define the Backlog Crisis


The security backlog stopped being a to-do list a while ago. It's now a number no team can staff against. The 2026 data shows how fast it grew, and why the old playbook of scan-more, triage-manually, fix-eventually has stopped working. We pulled 15 statistics from this year's primary industry reports and grouped them into the story they tell: the backlog is bigger than any team can staff for, attackers move faster than remediation cycles, and the teams pulling ahead are the ones that prioritize by exploitability and automate the fix.
Key takeaways
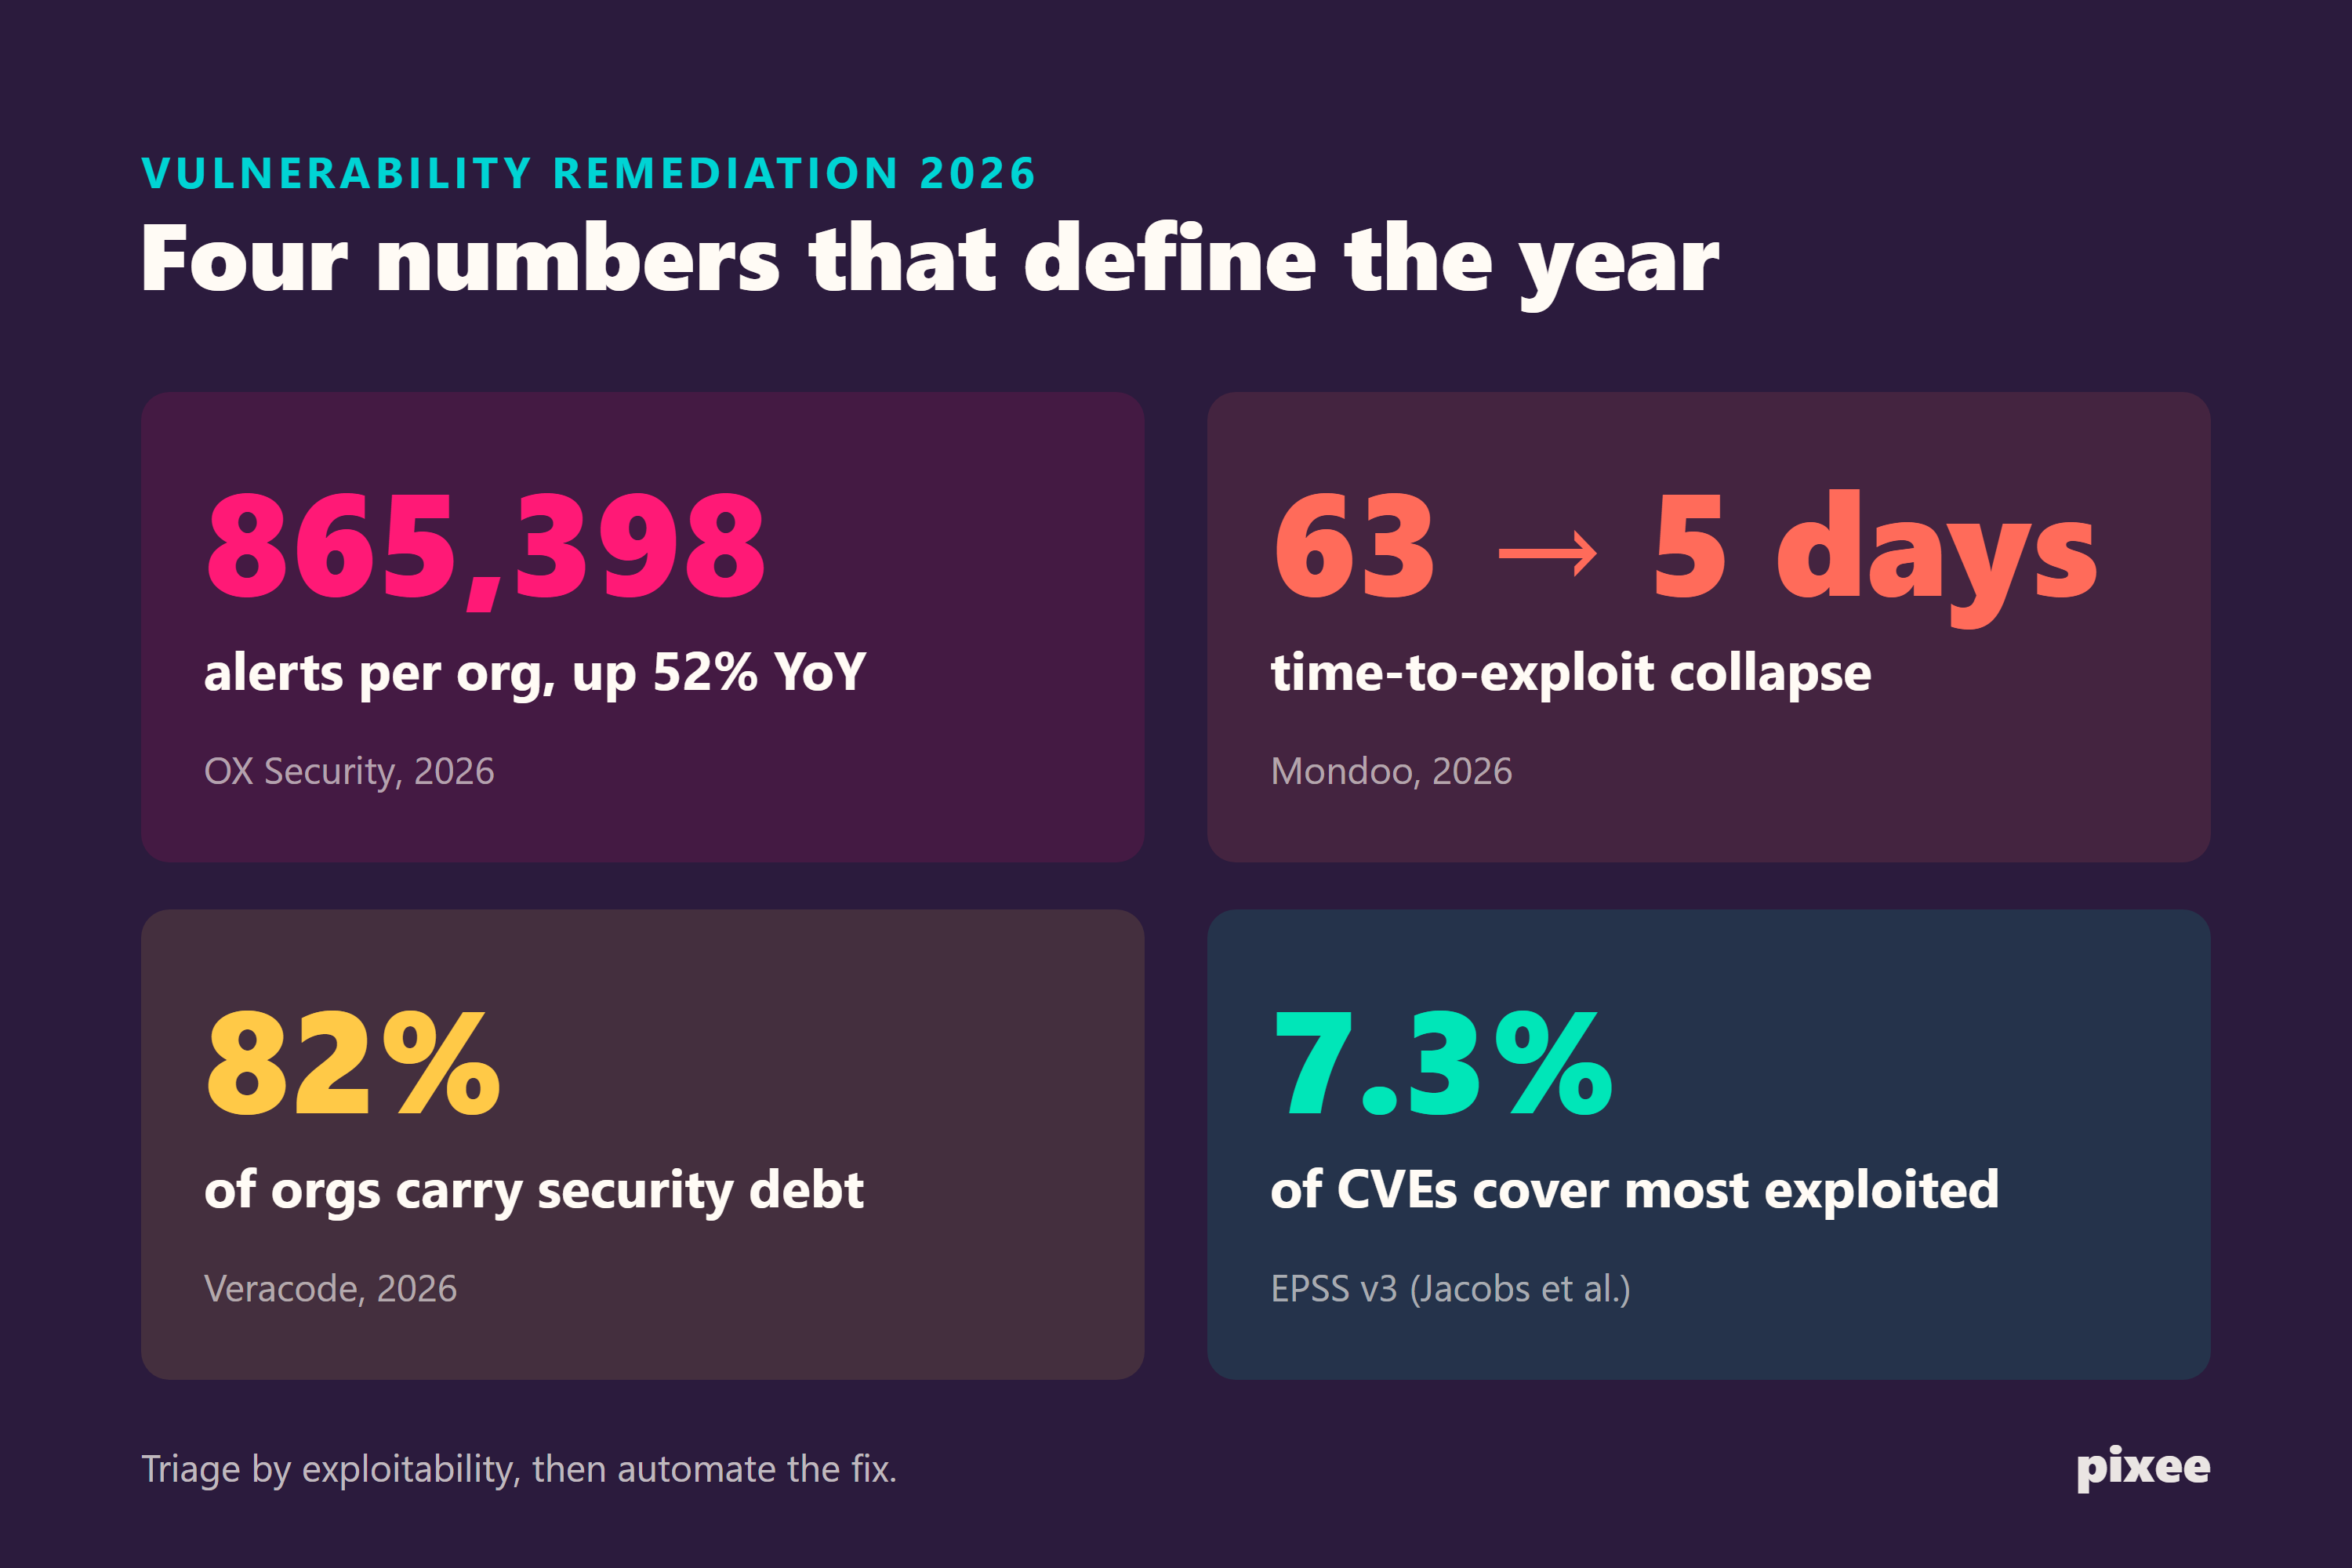
• Organizations now average 865,398 alerts each, up 52% year over year (OX Security's 2026 Application Security Benchmark).
• Time-to-exploit has collapsed from 63 days to 5 days (Mondoo, 2026).
• 82% of organizations carry security debt (Veracode, 2026).
• Remediating just 7.3% of known CVEs covers most of the vulnerabilities attackers actually exploit (EPSS v3 paper, Jacobs et al.).
The backlog is bigger than any team can clear
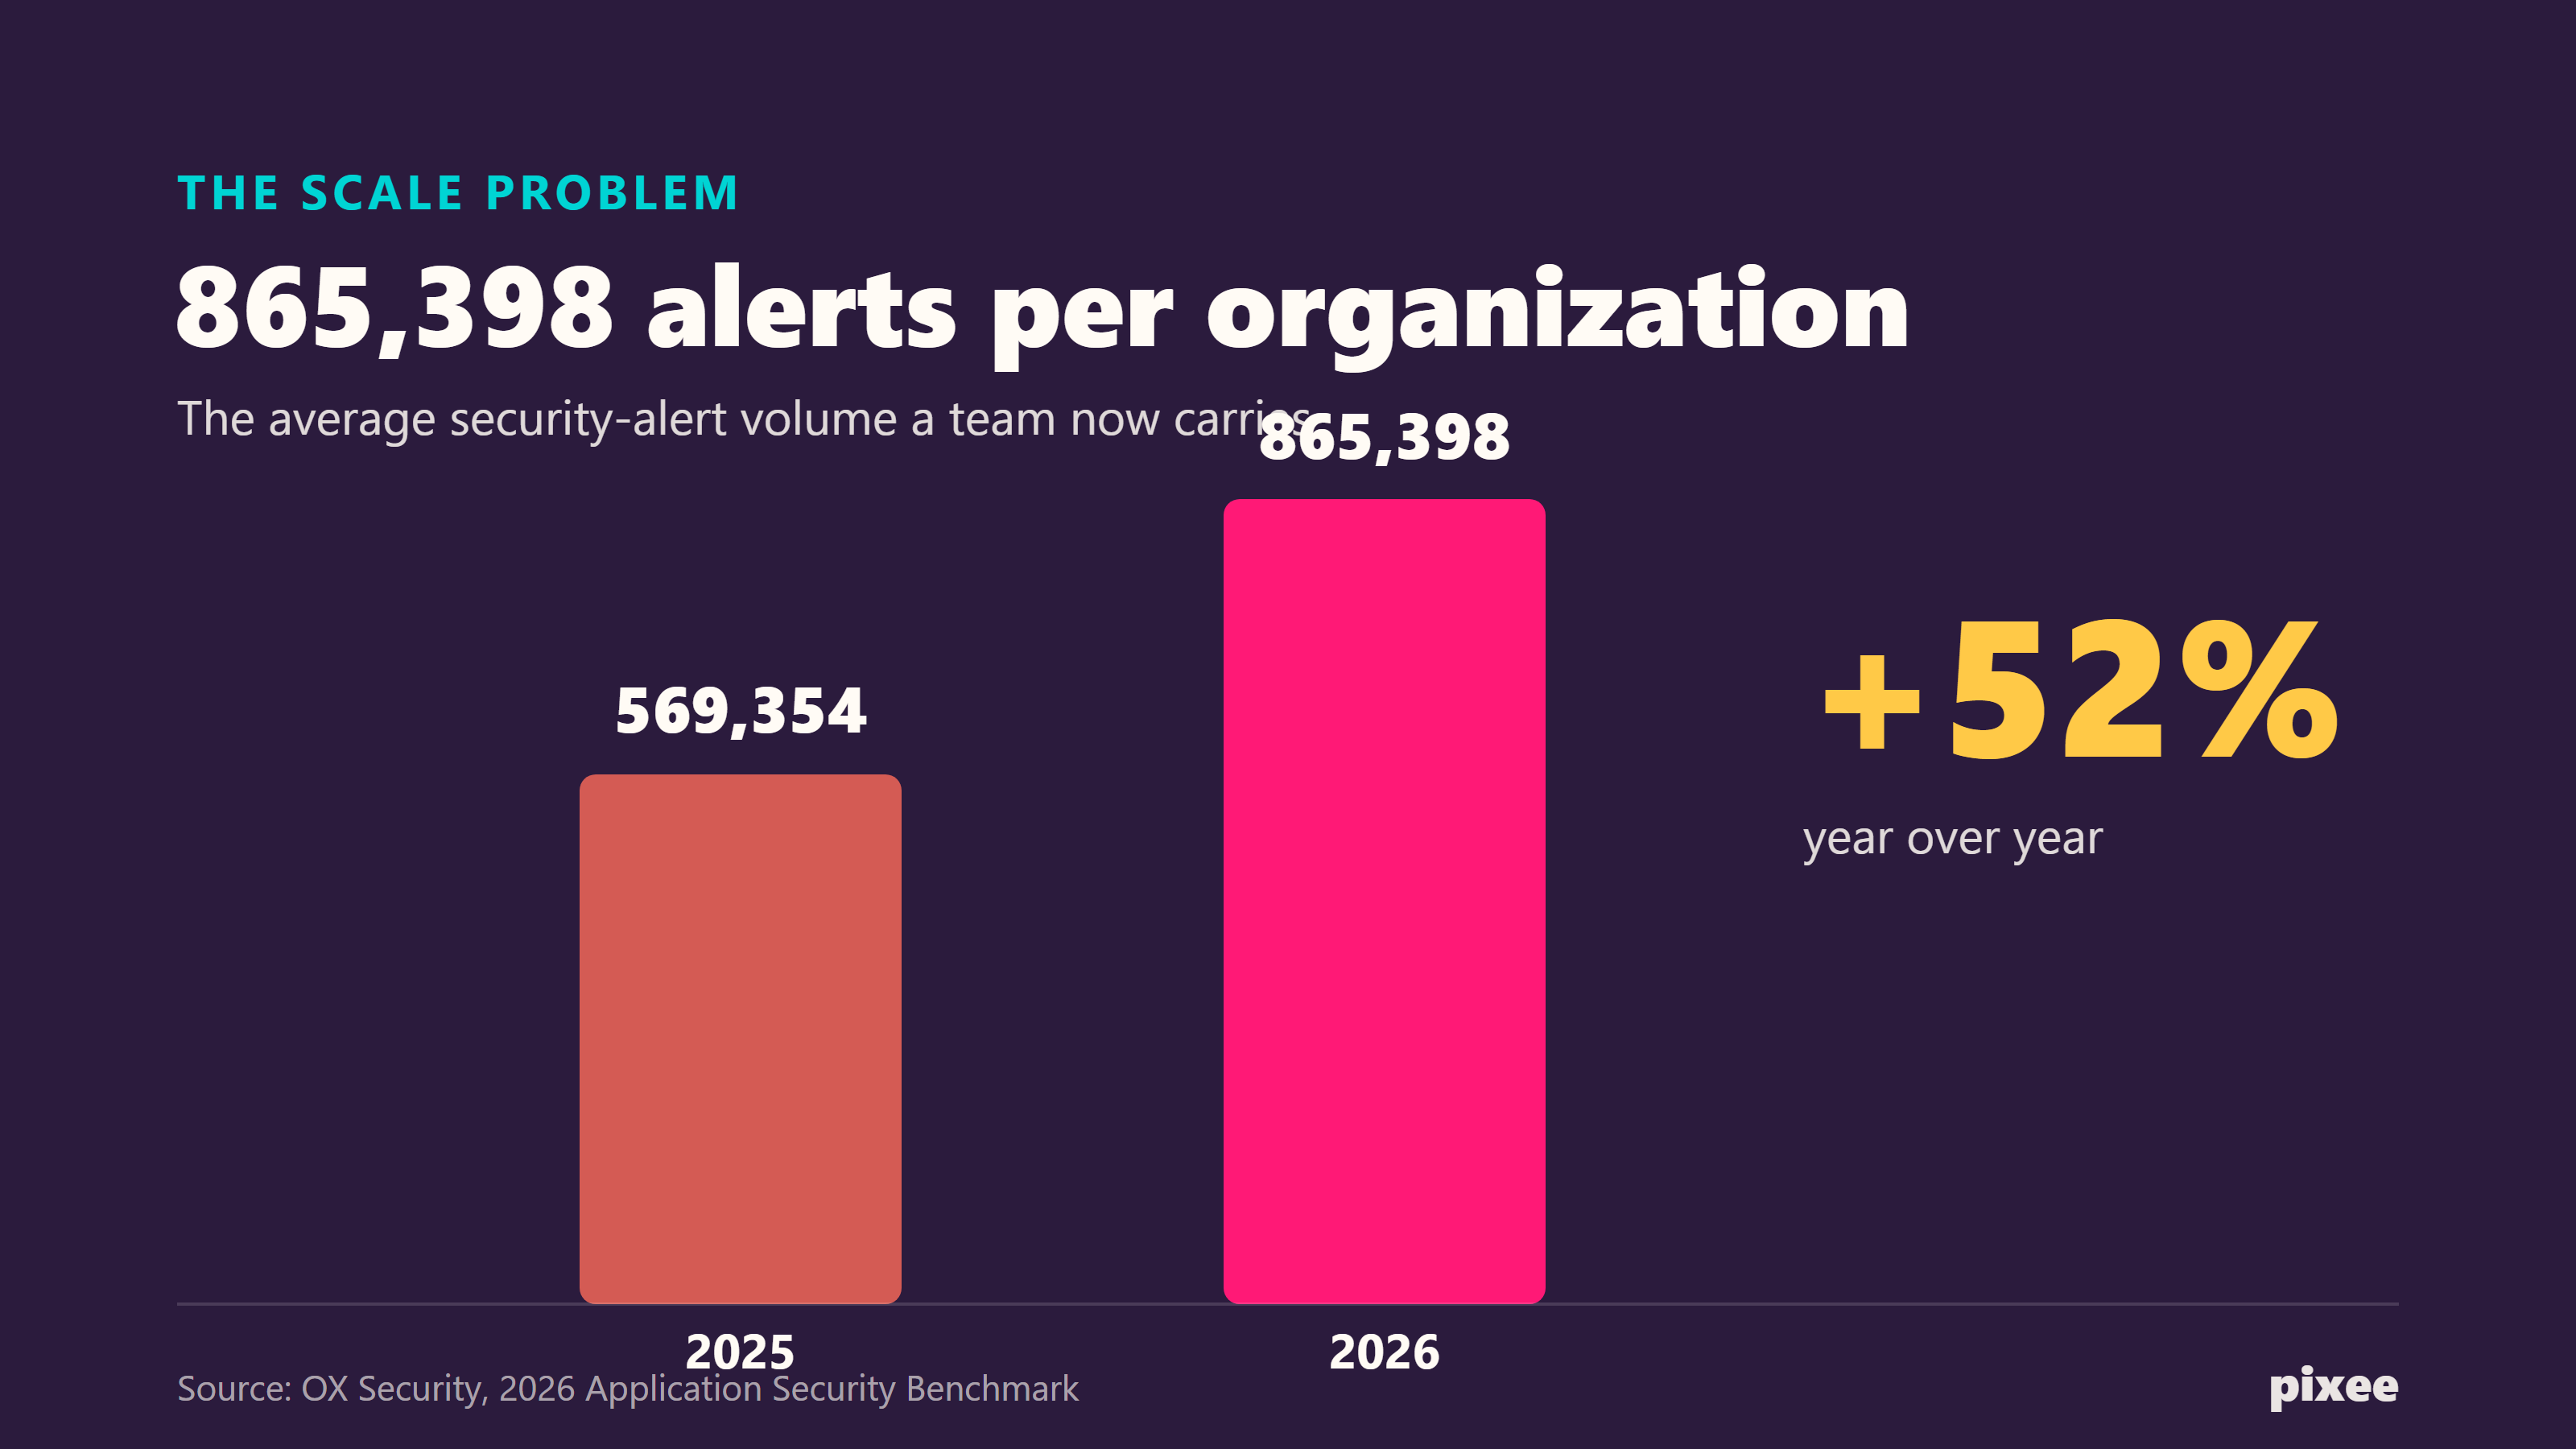
865,398. Organizations average 865,398 alerts each, up 52% from 569,354 the prior year, and critical findings alone nearly quadrupled to 795 per org (OX Security's 2026 Application Security Benchmark). Even after prioritization, that critical count is more than most teams close in a quarter.
141.3 million. Veracode analyzed 1.6 million applications and 141.3 million raw findings, and reported that 82% of organizations now carry security debt, up 11 points year over year, with 60% carrying critical debt (Veracode, 2026). At 82%, security debt is the norm, not the exception.
50,000 CVEs. FIRST's 2026 median forecast lands near 59,427, making 2026 the first year projected to exceed 50,000 CVEs (FIRST, 2026).
48,175. Mondoo counted 48,175 CVEs published in 2025, up 21% year over year at roughly 132 per day (Mondoo, 2026). The inflow alone outpaces manual triage.
Pixee POV: Volume is why triage and remediation have to move together. Pixee's triage automation delivers up to 95% false-positive reduction so teams stop drowning in noise, and its remediation automation lands context-aware fixes at a 76% merge rate so the backlog actually shrinks instead of just getting re-sorted.
Attackers move faster than remediation cycles
Volume alone would be survivable if teams had the time to work it, but they don't.
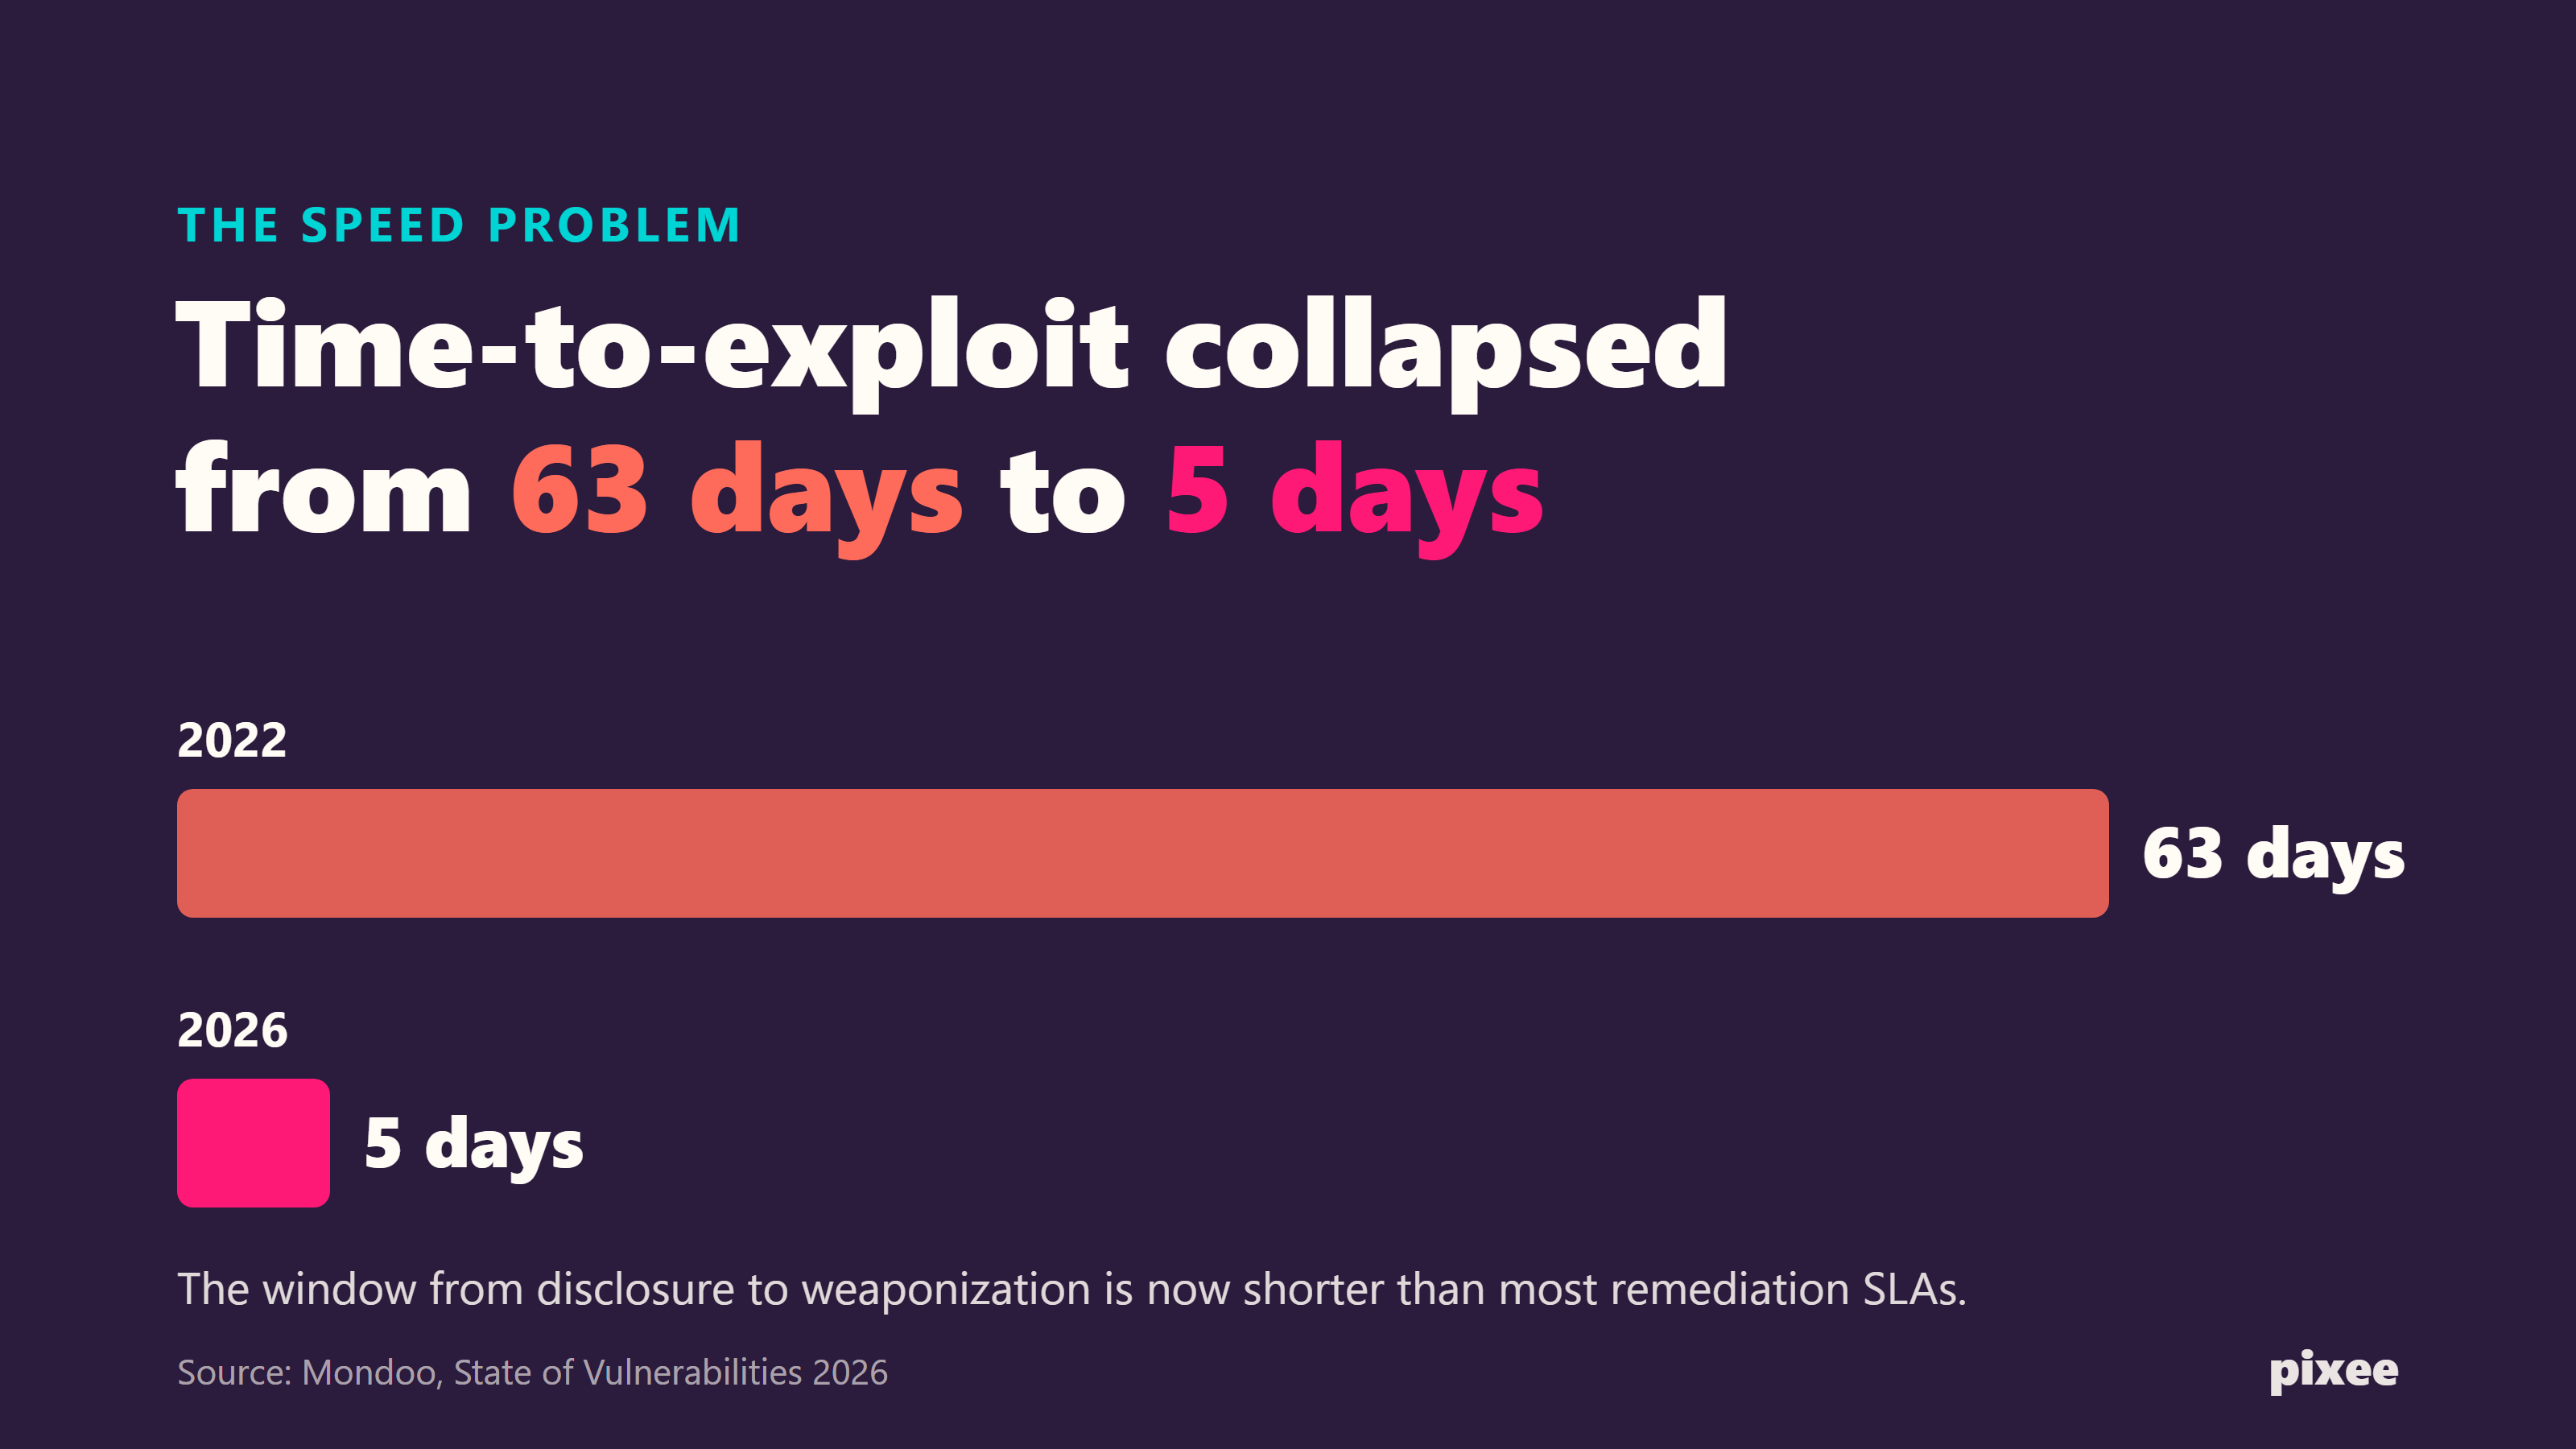
63 days to 5 days. Time-to-exploit has collapsed from 63 days to 5 days (Mondoo, 2026). The window between disclosure and weaponization is now shorter than most remediation SLAs.
78%. Despite that shrinking window, 78% of organizations are still running known critical vulnerabilities in production (Orca Security's 2026 State of Application Security).
66%. The most dangerous, longest-lived flaws are concentrated in third-party and open-source dependencies, which account for 66% of them (Veracode, 2026). These are exactly the findings manual remediation defers because the fix touches code the team didn't write.
Why remediation stalls
What stalls remediation is the human effort between a finding and a merged fix.
7 hours a week. Development teams lose 7 hours per week per member to inefficient processes, and 76% of teams find compliance issues only after deployment (GitLab, 2026).
4.6x. AI is adding to the load. AI-generated pull requests wait 4.6x longer for review than human-authored ones, and AI-generated code carries 15-18% more vulnerabilities (Opsera, 2026).
38%. High-risk AI vulnerabilities have the worst resolution rate of any asset type, at just 38% (Cobalt, 2026). The newest source of risk is also the least remediated.
What actually clears the backlog
The teams pulling ahead cut the queue down to what is exploitable, then automate the fix instead of assigning it.
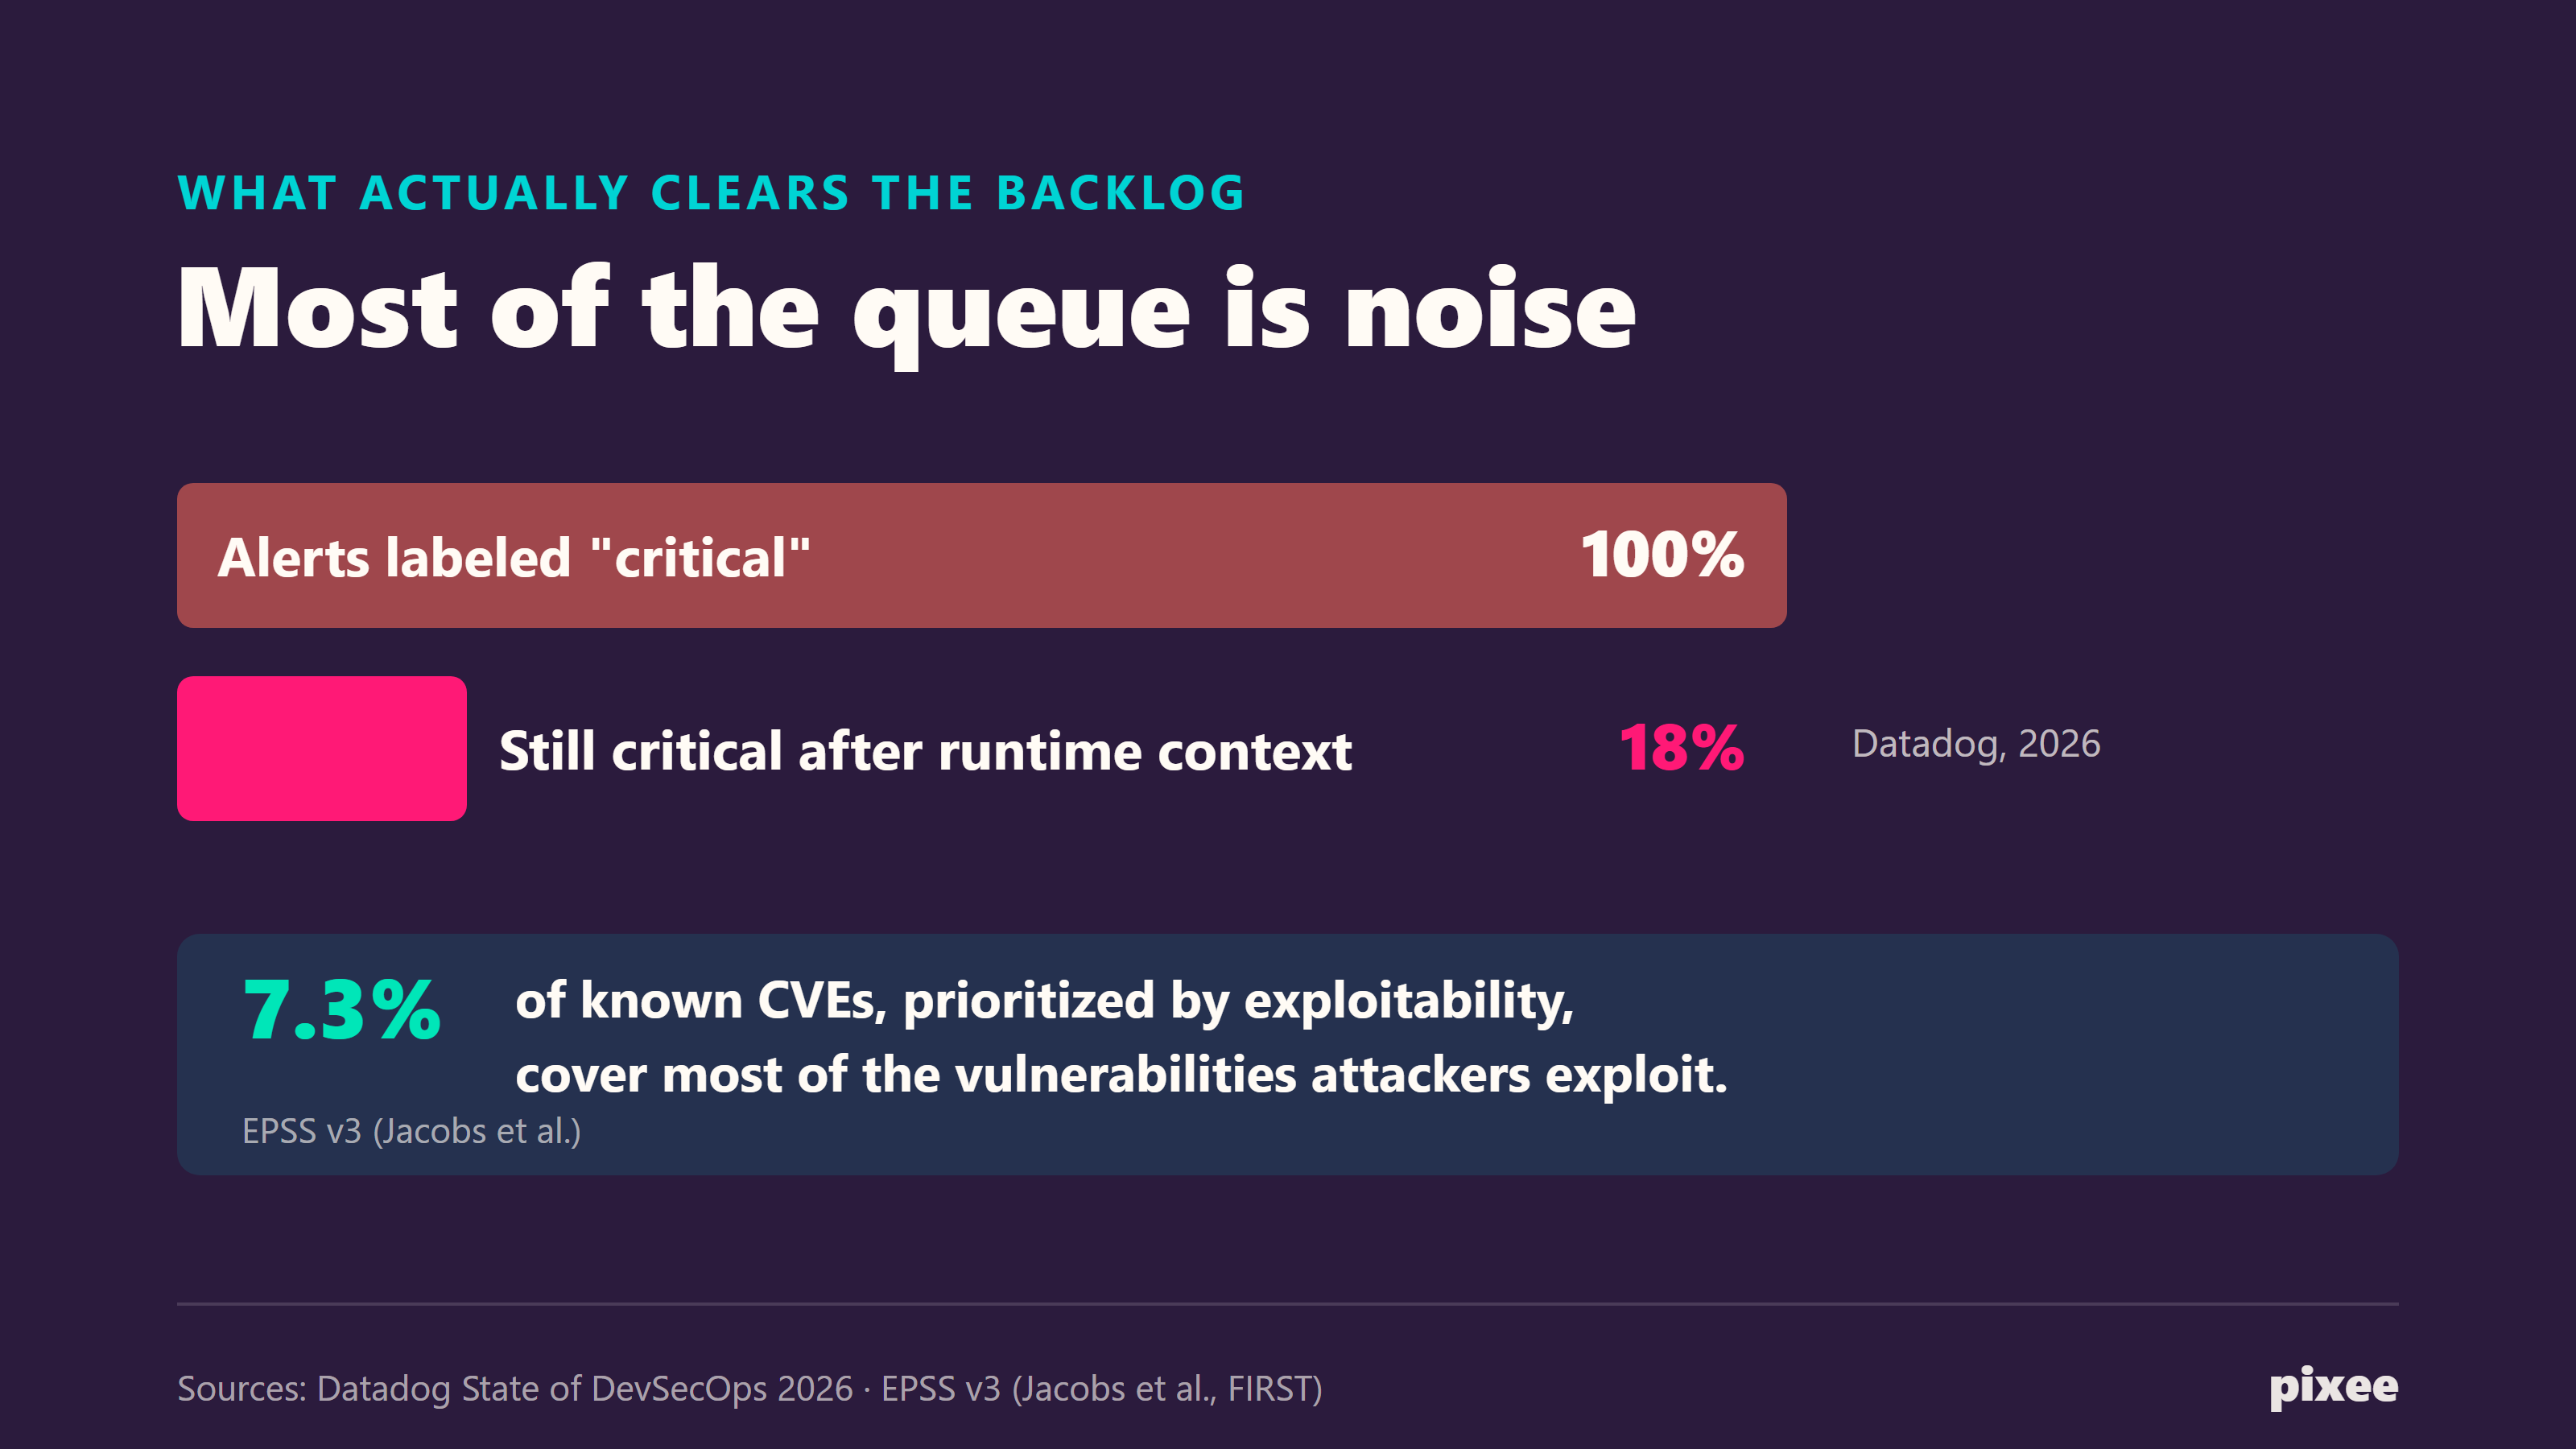
Only 18%. Just 18% of vulnerabilities labeled critical stay critical once runtime context is applied (Datadog, 2026). The other four in five are effectively false criticals stealing remediation time.
7.3%. Prioritization by exploitability makes the math tractable. Remediating just 7.3% of known CVEs, those scoring above the EPSS 0.088 threshold, covers roughly 82% of the vulnerabilities that actually get exploited (EPSS v3 paper, Jacobs et al.). The vast majority of the queue is noise you can safely defer.
95%. The market has caught up to this. 95% of teams now expect intelligent, automated remediation to become standard practice (ActiveState, 2026).
97% and 56%. 97% of organizations tie remediation SLAs to severity, but only 56% report automated vulnerability management (Hackuity, 2026). Nearly every team sets severity-based SLAs; far fewer have automated the work to meet them.
Pixee POV: This is the core of the resolution model. Pixee triages first (up to 95% false-positive reduction via exploitability analysis across 12 native scanner integrations), then remediates the survivors with context-aware fixes that match your code conventions, landing at a 76% merge rate and a 94% resolution rate.
What these numbers mean for your team
Put together, the 2026 numbers say remediation cannot be a manual, best-effort activity anymore. Findings are growing faster than any team can hire, the exploit window is now measured in days, and the effort per fix is what stalls the whole pipeline.
The teams staying ahead invert the workflow so exploitability decides what reaches an engineer, and the fix arrives as a reviewed pull request instead of a hand-written patch. That shift is measurable. When triage removes the four-in-five findings that runtime context proves harmless, and remediation lands the survivors as reviewed pull requests, the backlog stops compounding and starts shrinking.
If your security backlog is growing faster than you can close it, the lever is not another scanner. The scanners already found the problems; the work that stalls is everything that happens after the finding. See how Pixee automates both triage and remediation.
Frequently asked questions
What is the average vulnerability backlog in 2026? Organizations now average 865,398 security alerts each, up 52% year over year (OX Security's 2026 Application Security Benchmark), and 82% carry security debt (Veracode, 2026). The backlog outpaces what any team can staff for.
How fast are vulnerabilities exploited in 2026? Time-to-exploit has collapsed from 63 days to 5 days (Mondoo, 2026), yet 78% of organizations still run known critical vulnerabilities in production (Orca Security's 2026 State of Application Security).
What share of vulnerabilities actually need remediation? Only 18% of vulnerabilities labeled critical stay critical once runtime context is applied (Datadog, 2026), and remediating just 7.3% of known CVEs covers most of the vulnerabilities attackers exploit (EPSS v3 paper, Jacobs et al.). Prioritizing by exploitability is what makes the backlog tractable.
Methodology & sources
Every statistic above is drawn from a primary industry report published in 2025 or 2026, cited inline with its source and year. Figures are quoted as the source states them, not aggregated into ranges.
• OX Security. 2026 Application Security Benchmark Report (216M+ findings across 250 organizations).
• Veracode. State of Software Security 2026 (1.6M applications, 141.3M findings).
• FIRST. 2026 Vulnerability Forecast Report.
• Mondoo. State of Vulnerabilities 2026 (48,175 CVEs analyzed).
• Orca Security. 2026 State of Application Security Report.
• GitLab. 2026 Global DevSecOps Report, with The Harris Poll.
• Opsera. AI Coding Impact 2026.
• Cobalt. State of Pentesting 2026 (16,500+ pentests, 2,700 organizations).
• Datadog. State of DevSecOps 2026.
• Endor Labs. EPSS + Reachability Analysis, synthesizing the EPSS v3 paper (Jacobs et al., FIRST).
• ActiveState. 2026 State of Vulnerability Management & Remediation Report.
• Hackuity. 2026 Vulnerability Management Trends.
Pixee proof metrics (up to 95% false-positive reduction, 76% merge rate, 94% end-to-end resolution rate) are from Pixee's customer cohort, 2025.