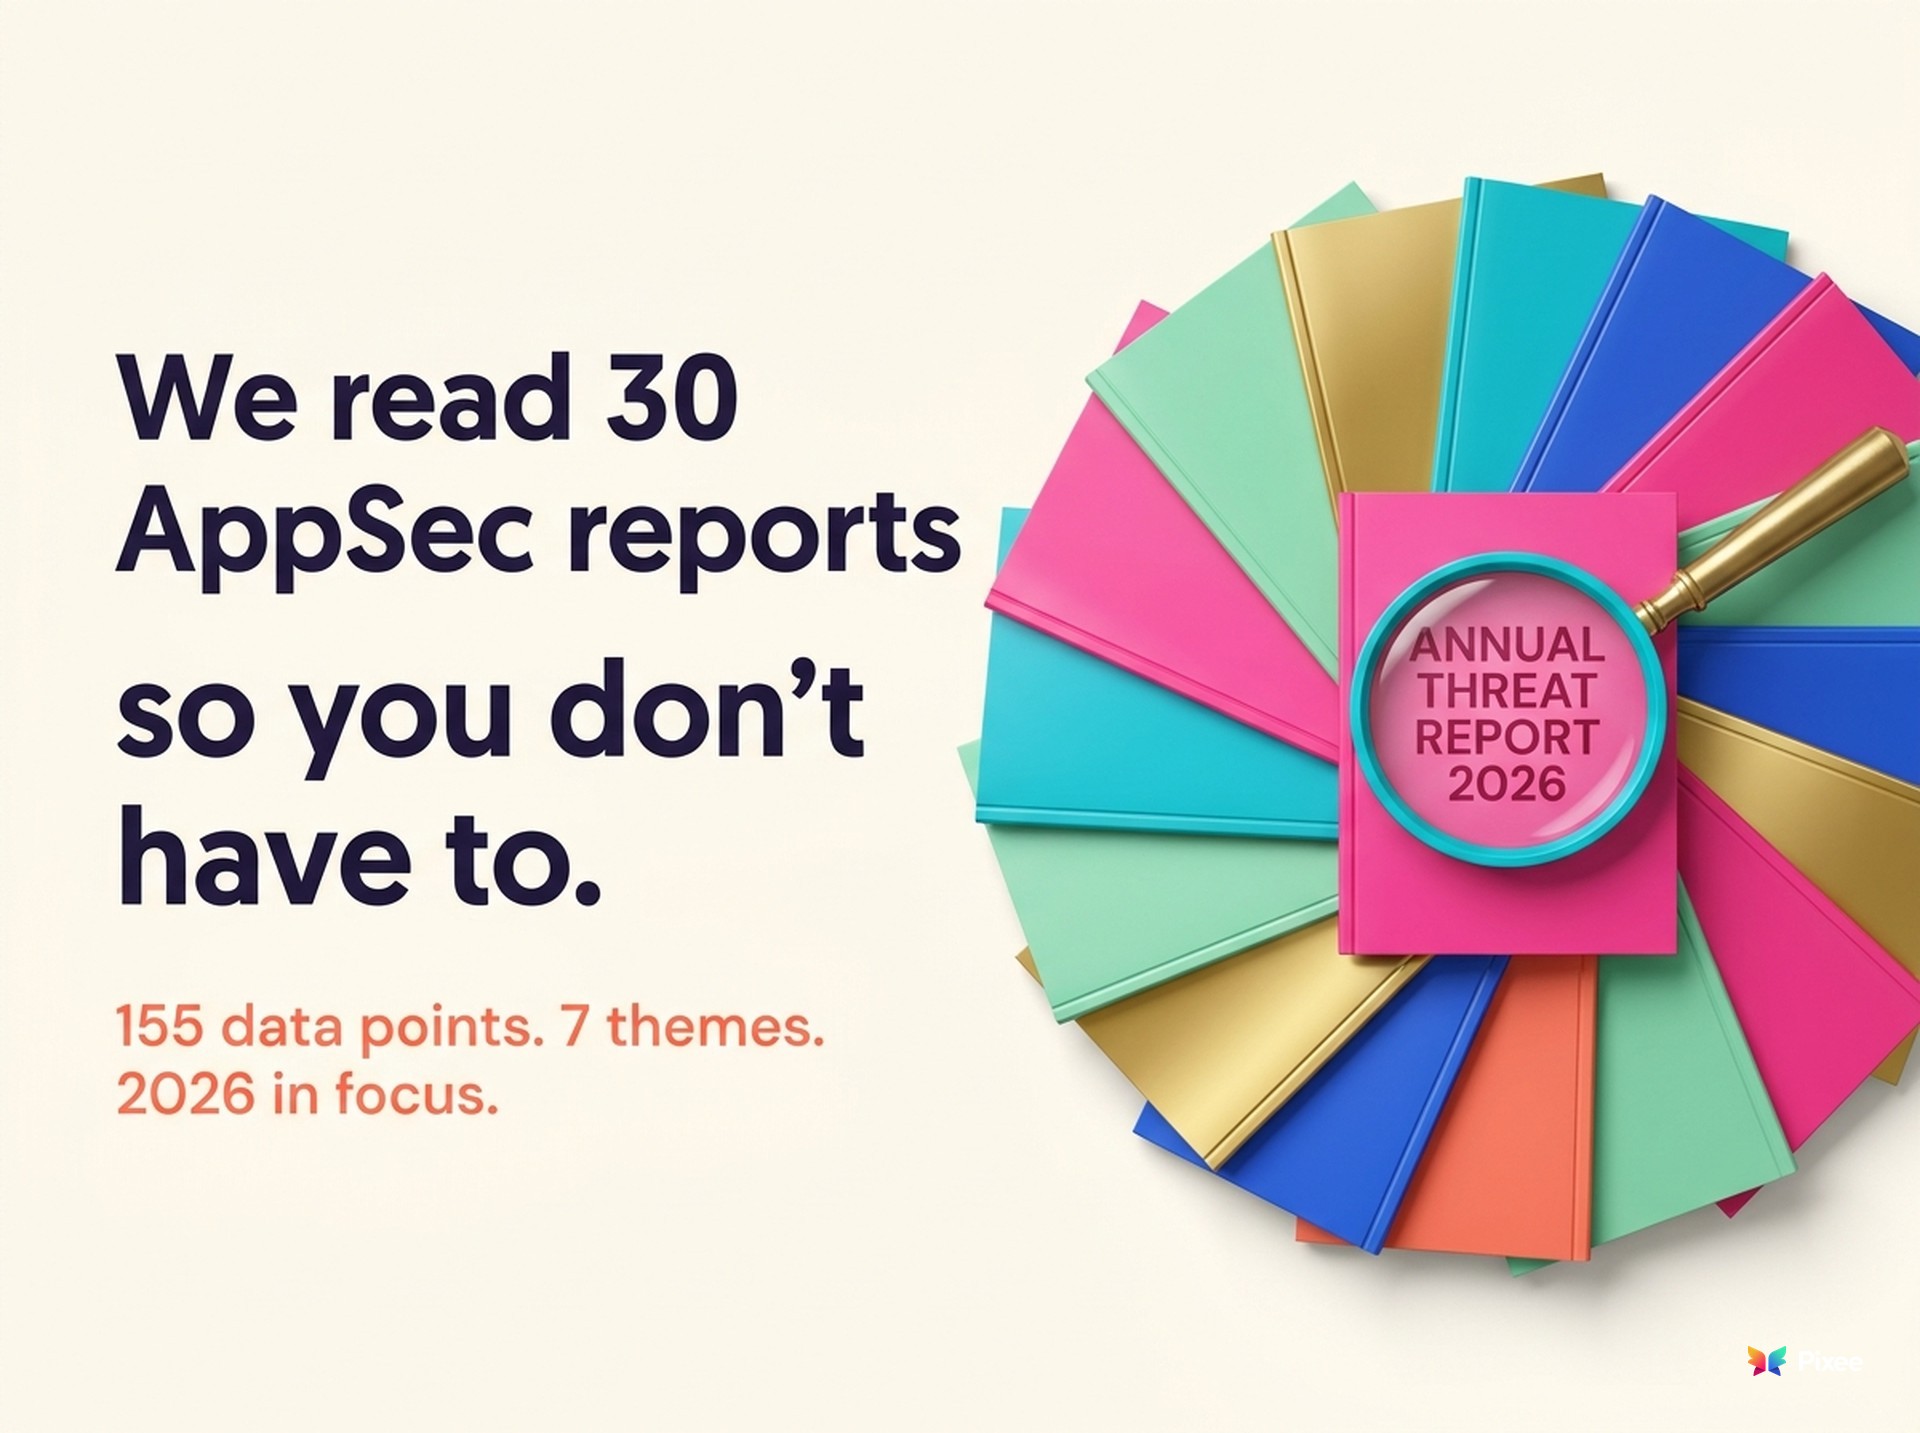
We Read 30 AppSec Reports So You Don't Have To. Here's What 2026 Looks Like.

A 2026 Security Industry Meta-Analysis
By Victor Sowers
The short version: Pixee read 30 security reports published between November 2025 and April 2026: Verizon, CrowdStrike, Mandiant, Veracode, Endor Labs, IANS, and 24 others. The numbers describe one half of the security function running at industrial scale (865K alerts per year, 141M findings, 132 CVEs per day) and the other half running at artisanal scale (252-day MTTR, 82% security debt, 38% AI vuln fix rate). We read the gap one specific way, and we name our read in Section 9 alongside the framework the Cloud Security Alliance published in April.
1. Why No Single Report Is Enough
Every year, the security industry publishes dozens of reports. Each tells a version of the story. Verizon covers breaches. CrowdStrike covers adversaries. Veracode covers code. The problem is that no single report tells the whole story, and every publisher has incentive to emphasize findings that support their product category.
So we read all of them. Thirty reports from thirty different publishers, released between November 2025 and April 2026. Nine flagship threat reports, including the Verizon DBIR (22,052 incidents, 12,195 confirmed breaches), Mandiant M-Trends (500,000+ hours of incident response), and CrowdStrike's Global Threat Report (281+ adversary groups tracked). Nine AppSec and DevSecOps reports, including Veracode's analysis of 1.6 million applications generating 141.3 million raw findings. Seven AI code security reports, including the Endor Labs/Carnegie Mellon benchmark testing 200 real-world tasks across 77 CWE classes. Five vulnerability and supply chain reports rounding out the dataset.
We extracted 155+ quantitative data points and organized them into seven thematic clusters. Where reports agreed, we treated the convergence as signal. Where they disagreed, we documented both figures and reconciled the difference. Vendor bias doesn't disappear when you read more reports, but consistent patterns across competing vendors are more likely to reflect ground truth than any single publisher's narrative.
The reports span the full security lifecycle. On the attack side: how fast adversaries move, what vectors they use, how they monetize access. On the defense side: how much debt organizations carry, how many alerts they ignore, how fast they patch. On the emerging front: how AI-generated code introduces new vulnerability classes, how supply chain attacks are evolving beyond malicious packages, and how the people responsible for security are losing confidence in their ability to keep up.
Here's what the data actually says.
2. Nobody's Fixing Anything
 82% of organizations carry security debt unfixed for more than a year. Source: Veracode State of Software Security 2026 (n=1.6M applications).
Every organization we know has a vulnerability scanner. Almost none have a vulnerability fixer.
Veracode's State of Software Security 2026 analyzed 1.6 million unique applications and found that 82% of organizations carry security debt, defined as flaws that remain unfixed for more than a year. That figure is up 11% year over year. Sixty percent of those organizations carry critical security debt, up 20% relative to the prior year. The detection machine is working. Veracode processed 141.3 million findings: 115.6 million from SAST, 22.1 million from SCA, and 3.6 million from DAST. The scanning infrastructure generates findings at industrial scale.
But findings don't equal fixes. High-risk vulnerabilities spiked 36% year over year in Veracode's dataset. The inbound rate is accelerating. The outbound rate, the rate at which teams actually close findings, is not.
GitLab's DevSecOps survey of 3,266 professionals adds a timing dimension: 76% of organizations discover compliance issues after deployment, not during development. The costliest possible moment to find a flaw is after it's running in production. And yet that's where most organizations find them.
Orca Security's State of AppSec 2026 found that 78% of organizations are running critical vulnerabilities in production right now. Not in their backlog. In production. Serving traffic. The Verizon DBIR reinforces this: 46% of perimeter device vulnerabilities remained unresolved in their dataset.
The container ecosystem tells the same story from a different angle. ActiveState's Container Security report surveyed 250 DevSecOps leaders and found that 82% had suffered a container-related breach, 78% had failed a compliance audit due to container CVEs, and 90% are still using lightly modified public container images.
The resolution rate for AI vulnerabilities is particularly telling. Cobalt's State of Pentesting 2026, drawing on 16,500+ pentests, found that the fix rate for high-risk AI vulnerabilities is 38%, the worst of any asset category they tested. The newest attack surface has the weakest remediation capacity.
On the automation front, DigiCert's supply chain security report found that only 13% of organizations are fully automated in supply chain security. Only 12% are fully prepared for regulatory requirements. Only 17% consistently sign their SBOMs.
The services running on end-of-life language versions compound the problem. Datadog found that services on EOL language versions have a 50% exploitable vulnerability rate, compared to 31% for supported versions. Half of organizations adopt new library versions within 24 hours, suggesting the update infrastructure exists. The bottleneck isn't the ability to upgrade. It's the confidence that an upgrade won't break something, and the capacity to validate that it won't.
The direction of the market, though, is clear. ActiveState found that 95% of DevSecOps leaders expect intelligent remediation to become standard practice. The gap between where organizations are (13% automated) and where they expect to be (95% expecting automation as standard) defines the market opportunity for the next three years. The question isn't whether automated remediation will become standard. The question is how many breaches happen between now and when it does.
3. AI Writes Code That Works. And Breaks.
 87% of AI-generated agent code contains at least one vulnerability; the best agent+model combo produces secure code only 7.8% of the time. Source: Endor Labs/Carnegie Mellon Agent Security League 2026 (n=200 tasks across 77 CWE classes).
Forty-two percent of committed code is now AI-generated or assisted, according to SonarSource's developer survey of 1,100+ enterprise developers. Eighty-seven percent of that code contains at least one vulnerability.
That second number comes from the Endor Labs/Carnegie Mellon Agent Security League benchmark, which tested AI coding agents on 200 real-world tasks from 108 open-source projects across 77 CWE classes. The best-performing agent achieved 84.4% functional correctness but only 17.3% security correctness. The best combined result, Cursor paired with Claude Opus 4.6, produced secure code just 7.8% of the time. The code works. It passes tests. It's exploitable.
The verification gap compounds the problem. SonarSource found that 96% of developers don't fully trust AI output, but only 48% always verify before committing. That means 52% of developers sometimes commit unverified AI-generated code to production. Thirty-five percent access AI tools via personal accounts, creating shadow AI environments where organizations have zero visibility into what code is AI-generated.
Cycode's survey of 400+ CISOs and security practitioners found that 100% of companies now have AI-generated code in their codebases, but 81% of security teams lack visibility into which code is AI-generated. The specific vulnerability rates are damning. Cycode found AI generates XSS-vulnerable code 86% of the time and log injection vulnerabilities 88% of the time.
Opsera's benchmark of 250,000+ developers across 60+ enterprise organizations quantified the operational impact. AI code introduces 15-18% more vulnerabilities than human-written code, and AI-generated PRs wait 4.6 times longer for review than human PRs. The review bottleneck means the security review capacity hasn't scaled with the code creation rate.
The academic evidence is accelerating. Georgia Tech's Vibe Security Radar tracks CVEs attributable to AI-generated code through git history analysis. In January 2026, they found 6. In February, 15. In March, 35. That's exponential growth, and Georgia Tech estimates the true count is 5-10x higher than detected, putting it at 400-700 AI-attributable vulnerabilities.
The organizational response has been reactive. Cobalt's State of Pentesting found that 32% of AI/LLM pentest findings are rated high risk, 2.7 times the 12% baseline for other asset types. Prompt injection accounts for 37.6% of all AI pentest findings, making it the dominant vulnerability class. One in five organizations has already experienced an LLM security incident, and 61% are calling for a "strategic pause" on AI adoption. But pausing isn't realistic when 97% of organizations are already using or piloting AI coding assistants (Cycode) and 42% of committed code is already AI-generated (SonarSource). The security problem is already in production.
The productivity asymmetry deepens the challenge. Opsera found that senior developers get five times the productivity benefit from AI tools compared to juniors. The developers who gain the most from AI are the ones best equipped to catch security issues. The developers who gain the least are the ones most likely to produce insecure AI code. AI coding tools amplify existing skill gaps rather than closing them.
The secrets dimension makes it worse. GitGuardian's Secrets Sprawl 2026 documented 28.65 million new hardcoded secrets on public GitHub, a 34% increase year over year. Claude Code co-authored commits leak secrets at roughly twice the baseline rate. AI-service credential leaks surged 81% to 1.27 million, and 24,008 secrets were found exposed in MCP configuration files, a new attack surface that didn't exist 18 months ago.
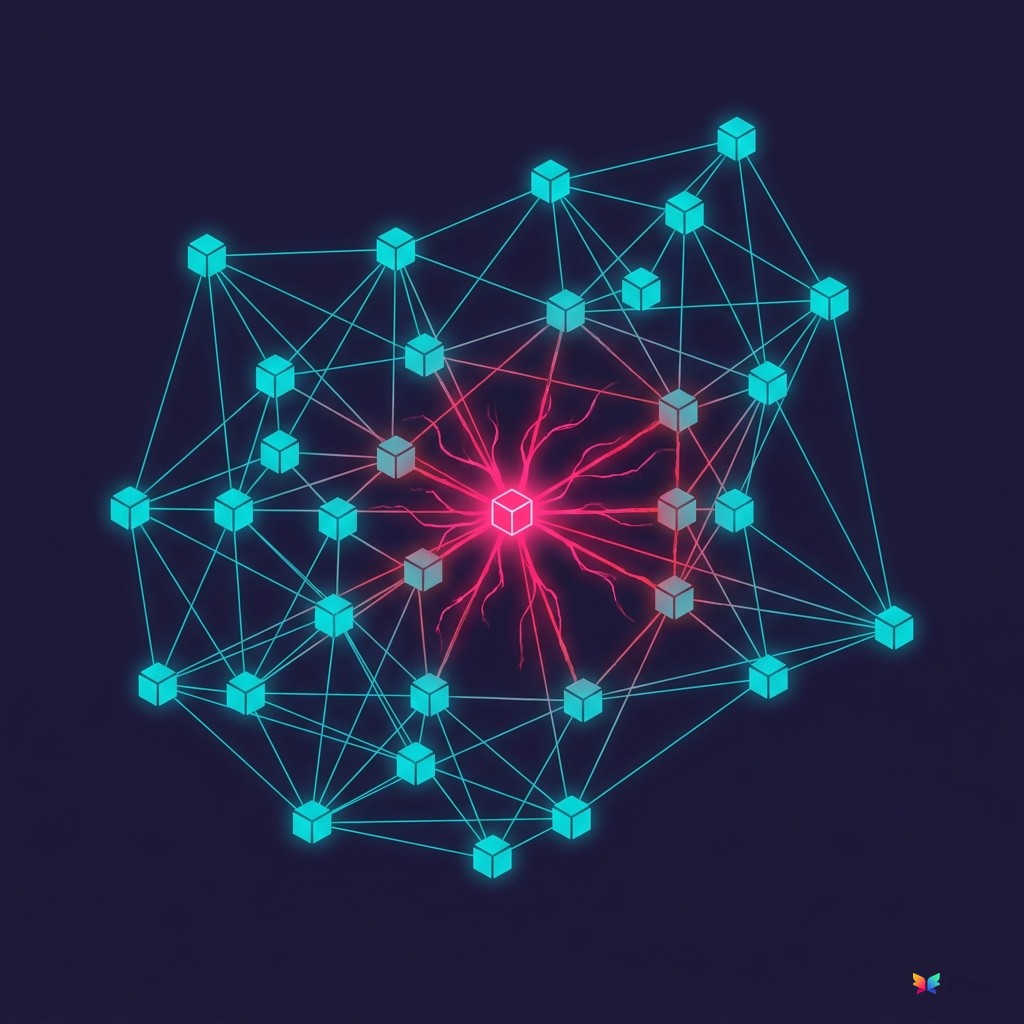
4. The First Worm Hit npm
 30% of all breaches now involve third-party components — doubled YoY. The Shai-Hulud worm autonomously infected 1,000+ npm packages and exposed ~25,000 GitHub repos. Source: Verizon DBIR 2026 (n=22,052 incidents) + ReversingLabs SSCS 2026.
In early 2026, a worm named Shai-Hulud infected over 1,000 npm packages autonomously. It didn't just add malicious packages to the registry. It compromised existing legitimate packages and spread on its own, exposing approximately 25,000 GitHub repositories. ReversingLabs documented this in their fourth annual supply chain security report as the first registry-native worm malware, a new class of supply chain attack.
Third-party risk is no longer a sub-category of security risk. The Verizon DBIR 2026 found that 30% of all breaches now involve third-party components, doubled from approximately 15% the prior year. Veracode found that 66% of the most dangerous, longest-lived vulnerabilities originate from third-party and open-source code.
ReversingLabs reported a 73% increase in malicious open-source package detections overall, but the ecosystem-level picture is more nuanced. PyPI malware detections dropped 43% and NuGet dropped 60%, suggesting that platform-specific security investments are working. Attackers are shifting to less-defended ecosystems: npm, AI model repositories, and agentic AI skill marketplaces.
The AI supply chain is the newest attack surface. IBM X-Force documented the OpenClaw/ClawHavoc campaign, in which 1,100+ malicious AI agent skills were uploaded to ClawHub. ReversingLabs separately documented attacks on Hugging Face via the NullifAI campaign. Mondoo detected 192,742 malware packages in 2025, four times more than CVEs, meaning the majority of malicious code in package registries is invisible to traditional vulnerability scanners.
The regulatory dimension is catching up. DigiCert found that only 12% of organizations are fully prepared for incoming supply chain regulatory requirements, and 55% have extensive preparation remaining. Only 17% consistently sign their SBOMs. The gap between regulatory expectations and operational readiness means supply chain incidents will increasingly carry compliance consequences on top of the security impact.
What makes this moment different from previous supply chain scares is the convergence. Package registries are being targeted by worms (Shai-Hulud). AI model repositories are being targeted by poisoning campaigns (NullifAI on Hugging Face). AI agent skill marketplaces are being targeted by malicious uploads (ClawHavoc on ClawHub). The supply chain attack surface is expanding into every new platform where code or models are shared. The attack patterns that matured in npm and PyPI are being replicated, sometimes within months, in every new ecosystem that gains developer adoption.
The supply chain isn't a risk category. It's the risk category.
5. 865,000 Alerts. Good Luck.
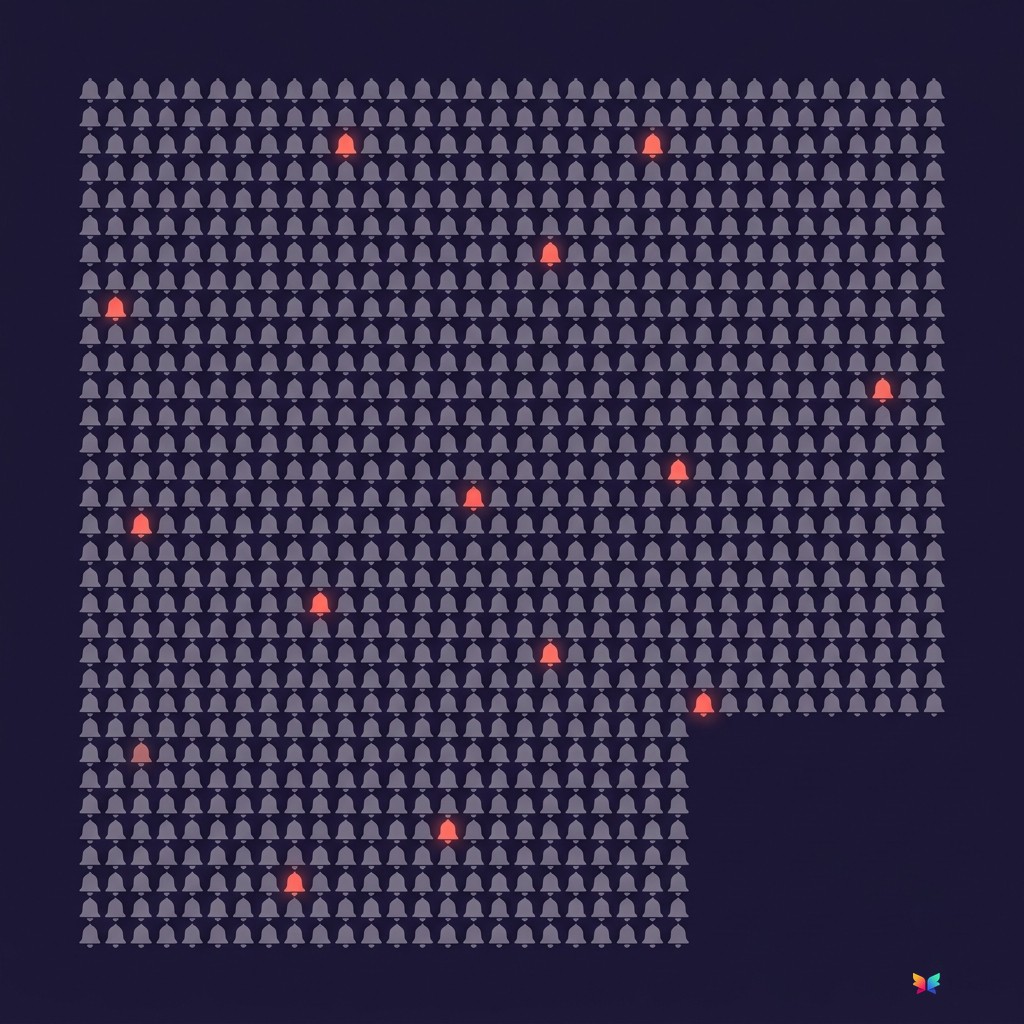 865,398 average alerts per organization per year (up 52% YoY); only 18% of "critical" findings remain critical after runtime context applied. Source: OX Security AppSec Benchmark 2026 (n=216M findings, 250 organizations) + Datadog State of DevSecOps 2026.
The average organization generates 865,398 security alerts per year. That number is up 52% in twelve months. Critical findings nearly quadrupled from 202 to 795 per organization. These figures come from OX Security's AppSec Benchmark, which analyzed 216 million+ findings from 250 organizations.
The noise is structural. Datadog's State of DevSecOps 2026 found that only 18% of vulnerabilities labeled "critical" remain critical after runtime context is applied. That means 82% of critical alerts are effectively false positives when reachability, exploitability, and deployment context are considered.
Tool sprawl amplifies the problem. GitLab's DevSecOps survey of 3,266 professionals found that 60% use five or more development tools and 49% use five or more AI tools. The result: seven hours per week per team member lost to inefficiency from tool-switching, duplicate findings, and conflicting priorities. Cycode found that 97% of organizations plan to consolidate their AppSec stack within a year, a near-universal signal that the current multi-tool model is failing.
The math is straightforward. AI coding tools generate more code. More code creates more findings. More findings hit the same number of security engineers. IANS Research found that 89% of security teams are stretched thin or understaffed. OX Security identified AI-assisted development as the primary driver of the 52% alert increase, a finding consistent with Opsera's 15-18% vulnerability rate increase from AI code. The input volume is accelerating. The processing capacity is flat.
The signal that organizations have recognized this problem is clear. Cycode found that 97% of organizations plan to consolidate their AppSec stack within a year. When virtually every enterprise plans the same architectural change, that's not a preference. That's a verdict on the current model.
Triage isn't optional. It's the bottleneck.
6. 29 Minutes From Access to Ownership
 29-minute average breakout time in eCrime intrusions (65% faster than 2024); median time-to-exploit dropped from 63 days to 5 days. Source: CrowdStrike Global Threat Report 2026 + Mondoo State of Vulnerabilities 2026.
Breakout time: 29 minutes. That's the average time from initial access to lateral movement in eCrime intrusions, according to CrowdStrike's Global Threat Report. The fastest recorded breakout was 27 seconds. This is 65% faster than 2024.
The speed cascade across the kill chain is documented by multiple independent sources. Mandiant M-Trends 2026 reports that attacker hand-off time, the interval between initial access and passing control to a second operator, has collapsed to 22 seconds. Down from eight hours in 2022. Unit 42's Incident Response Report, based on 750+ engagements, recorded the fastest exfiltration at 72 minutes from initial access, down from 285 minutes. Four times faster year over year.
The time-to-exploit collapse is the most operationally significant finding in the entire 30-report dataset. Mondoo found that the median time from vulnerability disclosure to active exploitation dropped from 63 days to 5 days (Mondoo telemetry across actively exploited CVEs in their dataset; full methodology in the source report). If your patch cycle is monthly, you're running with a minimum 25-day exposure window on every disclosed vulnerability.
Vulnerability exploitation has been the number one initial access vector for six consecutive years, according to Mandiant, accounting for 32% of compromises. The Verizon DBIR saw a 34% increase in exploitation as an initial access vector year over year. This isn't a new trend. It's a sustained, accelerating one that defenders have failed to reverse despite six years of data showing the same pattern.
For critical edge device vulnerabilities, the Verizon DBIR found the median time between disclosure and mass exploitation is now zero days. Not "zero-day vulnerabilities" in the traditional sense, but literally zero elapsed time between a CVE becoming public and attackers exploiting it at scale. CrowdStrike adds that 42% of vulnerabilities are exploited before they're publicly disclosed at all.
The volume problem compounds the speed problem. FIRST's Vulnerability Forecast projects approximately 59,427 CVEs for 2026, the first year to exceed 50,000. Mondoo recorded 48,175 CVEs in 2025, at a rate of 132 per day. Fortinet's sensor network blocked 3.8 trillion exploitation attempts and recorded automated reconnaissance at 36,000 scans per second.
CrowdStrike reported an 89% increase in AI-enabled adversary operations year over year. Microsoft's Digital Defense Report documented an 87% increase in cloud destructive campaigns. Cloud infrastructure, where most organizations now run their applications, is seeing the steepest acceleration in attacks.
Ransomware remains persistent, appearing in 44% of DBIR breaches, with Sophos observing 51 distinct ransomware brands, 24 of which were new. Unit 42 found that 87% of incidents now involve multi-surface attacks, meaning attackers don't stop at one vector. They chain exploits across code, identity, cloud, and supply chain simultaneously.
The combined picture across these reports is an industrial operation. Attackers have automated reconnaissance (36,000 scans per second), accelerated exploitation (5-day time-to-exploit), compressed lateral movement (22-second handoff), and diversified their revenue model across ransomware, data theft, and cryptocurrency fraud. Defenders running manual processes are competing against manufacturing-grade adversary infrastructure.
7. The People in Charge Are Running Out of Rope
 89% of security teams are stretched thin or understaffed; 70% of CISOs are open to a career move in 2026. Source: IANS State of the CISO 2026 (n=662 CISOs).
IANS Research surveyed 662 CISOs and found that 89% of security teams are stretched thin or understaffed, 52% say their scope is no longer fully manageable, and 70% are open to a career move in 2026.
But here's the thing. CISOs have never had more organizational authority. Forty-seven percent now hold executive-level titles in large enterprises, up from 33% in 2023. Thirty-six percent report outside IT entirely, to the CEO, COO, General Counsel, or CRO. The title elevated. The resources didn't follow.
Cobalt's survey of 450 security leaders measured the psychological cost: security team confidence dropped 13 points in a single year, from 64% to 51%. The people responsible for protecting organizations are below the halfway mark in confidence for the first time on record.
The AI dimension adds a new layer. Arkose Labs surveyed 300 enterprise leaders and found that 97% expect a material AI-agent security incident within 12 months. Forty-nine percent expect it within six months. But only 6% of security budget is allocated to AI agent risk. Salt Security found that 47% of organizations have delayed production releases specifically due to AI API security concerns.
The identity dimension makes the pressure worse. Unit 42 found that 89% of their investigations involved identity weakness as a contributing factor, with 65% of initial access being identity-driven. CISOs are accountable for a security surface that now spans code, cloud, identity, AI agents, and supply chain. The scope expanded. The budget didn't follow. The staff didn't follow. And 70% of CISOs are open to walking away.
For the organizations those CISOs leave behind, the institutional knowledge goes with them. The security program's effectiveness becomes dependent on whoever comes next, starting from scratch with the same understaffed team and the same overwhelming backlog.
8. When the Data Argues With Itself
 Endor Labs reports 87% AI vulnerability rate; Cycode reports 62%; Opsera reports a 15-18% increment over human code. All three are correct — they measure different things. Source: Section 8 reconciliation across Endor Labs, Cycode, and Opsera 2026 datasets.
One report says AI hasn't changed attacker behavior. Another says AI-enabled attacks are up 89%. Both are right.
CrowdStrike measures volume: 89% more adversary operations used AI tools. Sophos measures technique: their incident response cases showed no fundamentally new attack methods attributable to AI. GenAI made phishing faster and more polished, but didn't introduce novel exploitation techniques. The distinction matters. AI is scaling existing attacks, not creating new categories of attacks. Yet.
Dwell time diverges significantly. Mandiant reports 14 days globally, up from 11. Sophos reports 3 days. The difference is sample composition. Mandiant handles complex APT and espionage engagements where attackers maintain persistence longer. Sophos handles more commodity ransomware where the attacker's goal is speed to encryption, not stealth.
AI vulnerability rates show the widest spread. Endor Labs says 87% of AI agent code has at least one vulnerability. Cycode says 62% from the latest LLMs. Opsera says 15-18% more than human code. These measure different things. Endor Labs tests full agentic workflows, the most complex scenario. Cycode tests standalone code generation. Opsera measures the incremental difference against a human baseline. All three confirm the same direction: AI code is measurably less secure.
The ecosystem data reveals a useful nuance. ReversingLabs shows 73% overall increase in malicious open-source packages, but PyPI malware dropped 43% and NuGet dropped 60%. Platform-level security investments work. The aggregate gets worse because attackers shift to less-defended ecosystems. The implication: security investment in specific platforms yields measurable results, even as the overall threat picture deteriorates.
The ransomware prevalence data shows a similar pattern. The Verizon DBIR reports ransomware in 44% of breaches. Mandiant M-Trends says only 13% of their investigations. The gap is dataset composition. The DBIR aggregates across many contributors with a broad sample skewed toward commodity incidents. Mandiant handles high-end incident response where ransomware may be delegated to separate teams or insurers. Both are accurate for their populations.
The Microsoft vulnerability data from BeyondTrust reveals another trap. Total Microsoft vulnerabilities dropped 6%, which sounds like progress. But critical vulnerabilities doubled. Azure and Dynamics 365 criticals went up 9x. Office vulnerabilities tripled to 157, with critical bugs increasing 10x. Organizations tracking headline vulnerability counts would see improvement. Organizations tracking exploitable severity would see an acceleration.
These contradictions aren't weaknesses in the data. They're the most analytically valuable findings in this entire analysis. Single-report narratives flatten complexity. Thirty reports reveal it.
9. Three Predictions for 2027
 Across 30 reports, every metric that measures finding vulnerabilities is going up. Every metric that measures fixing them is flat. Source: synthesis across all 30 reports cited above.
Two notes before the predictions.
First, our POV, named. Pixee built this analysis, and Pixee has a horse in the race we're about to describe. The patterns we highlight match the patterns our product roadmap addresses; weight that accordingly. We think the data justifies the read.
Second, the framework we used isn't ours. In April 2026, the Cloud Security Alliance (co-publishing with SANS, [un]prompted, and OWASP GenAI, with 70+ named CISO reviewers from Google, Cloudflare, Atlassian, Rivian, the NFL, and others) released The AI Vulnerability Storm: Building a Mythos-Ready Security Program. The paper prescribes 11 Priority Actions for security programs facing AI-accelerated vulnerability discovery. Read the 30 reports we surveyed against those 11 actions, and the same gap shows up in every cluster: detection is the part of the program that's working.
The paper's eleventh and final Priority Action names the part that isn't. PA 11 — Stand Up VulnOps. In CSA's words: "Long-term, there is no alternative to building a permanent Vulnerability Operations (VulnOps) function, staffed and automated like DevOps, but for autonomous vulnerability research and remediation." The function definition, verbatim from the paper: "Owns continuous discovery of zero-day vulnerabilities across your entire software estate (from your own code to third-party software), and establishes automated remediation pipelines. Design VulnOps around triage discipline from the start."
The term itself was introduced by Heather Adkins (Google), Gadi Evron (Knostic), and Bruce Schneier in October 2025. This paper formalizes it into a security program prescription that starts within 6 months and completes the build within 12, at a CRITICAL severity rating.
That's where the 30 reports converge with the CSA prescription. 95% of DevSecOps leaders expect intelligent remediation to become standard practice (ActiveState). 97% plan to consolidate their AppSec stack within 12 months (Cycode). 78% are running critical vulnerabilities in production right now (Orca). The reports describe the symptoms. CSA names the function that resolves them. Pixee is building toward it. So is Knostic, whose leadership co-authored the paper and whose OpenAnt tool is named in PA 1. Other vendors will follow.
Three predictions, grounded in this data:
1. AI-attributable CVEs will exceed human-attributable CVEs for specific vulnerability classes by end of 2027, particularly XSS and injection flaws. Georgia Tech's 6 → 15 → 35 monthly trajectory and Cycode's 86–88% vulnerability generation rates make this directionally inevitable.
2. At least one major breach will be publicly traced to AI-generated code in 2026. 42% of committed code is AI-generated, 52% of developers don't consistently verify it, and Georgia Tech is already tracking 74 confirmed AI-attributed CVEs. The conditions are set.
3. VulnOps moves from CSA paper language to procurement category by end of 2027. Not "automated remediation" as a feature line on existing scanner contracts. A distinct category line, owned by security operations, with its own budget. The signal to watch: when one of the top-five SAST vendors as of mid-2026 (Snyk, Veracode, Checkmarx, SonarSource, GitHub CodeQL) acquires or builds a VulnOps-layer capability and re-positions around it, the category split is real. By "VulnOps-layer capability" we mean automated triage plus automated remediation plus an auditable disposition record, packaged as a distinct SKU rather than a feature added to an existing scanner. The 95% and 97% numbers above are the prerequisites. The first vendor move is the confirmation.
The 30 reports describe a market that has industrialized half the security function. The CSA paper names the function that builds the other half. The 24 months between now and the end of 2027 are when that function gets stood up — by Pixee, by the competitors who emerge in the category, and by the security organizations that decide whether VulnOps is the budget line they fund or the gap they continue to live with.
10. Methodology and Sources
This analysis synthesizes quantitative findings from 30 security industry reports published between November 2025 and April 2026, organized into four categories: Flagship Threat Reports (9), AppSec and DevSecOps (9), AI Code Security (7), and Vulnerability and Supply Chain (5).
We extracted data points from each report's key findings, statistical tables, and detailed analysis sections. Stats are attributed to their source report by name, publisher, and date throughout. Where reports present conflicting data, both figures are included with reconciliation analysis (Section 8).
Limitations: Every report in this dataset was produced by a vendor or institution with potential bias toward their product category or research focus. Dataset sizes, methodologies, and time periods vary across reports. Survey sample sizes range from 250 (ActiveState) to 3,266 (GitLab). Telemetry datasets range from 661 cases (Sophos) to 22,052 incidents (Verizon). Academic research (Georgia Tech, Carnegie Mellon) uses controlled benchmarks with different validity constraints than industry surveys. This meta-analysis identifies cross-report patterns and flags contradictions; it does not independently validate individual findings.
How to use the source links: Every statistic in this analysis is attributed to its source report by publisher and date, with an inline link to the original publication. For readers who want to verify a specific claim, click the publisher name in the relevant section to access the original report.

Related Reading
If the patterns above resonated, these Pixee posts go deeper on specific threads in the data:
Pixee: The 274x AI Code Security Problem Pixee: The Hidden Cost of AppSec Team Time on Triage Pixee: Your Security Backlog Is a Solvable Problem