MTTR in Cybersecurity: Why 252 Days Is Not a Speed Problem

One number haunts every AppSec leader's quarterly review: 252 days. That's the flaw half-life reported in Veracode's 2025 State of Software Security report -- the time it takes for half of all discovered vulnerabilities to be remediated. Not the mean. Not the average fix time. The point at which half the flaws are still open.
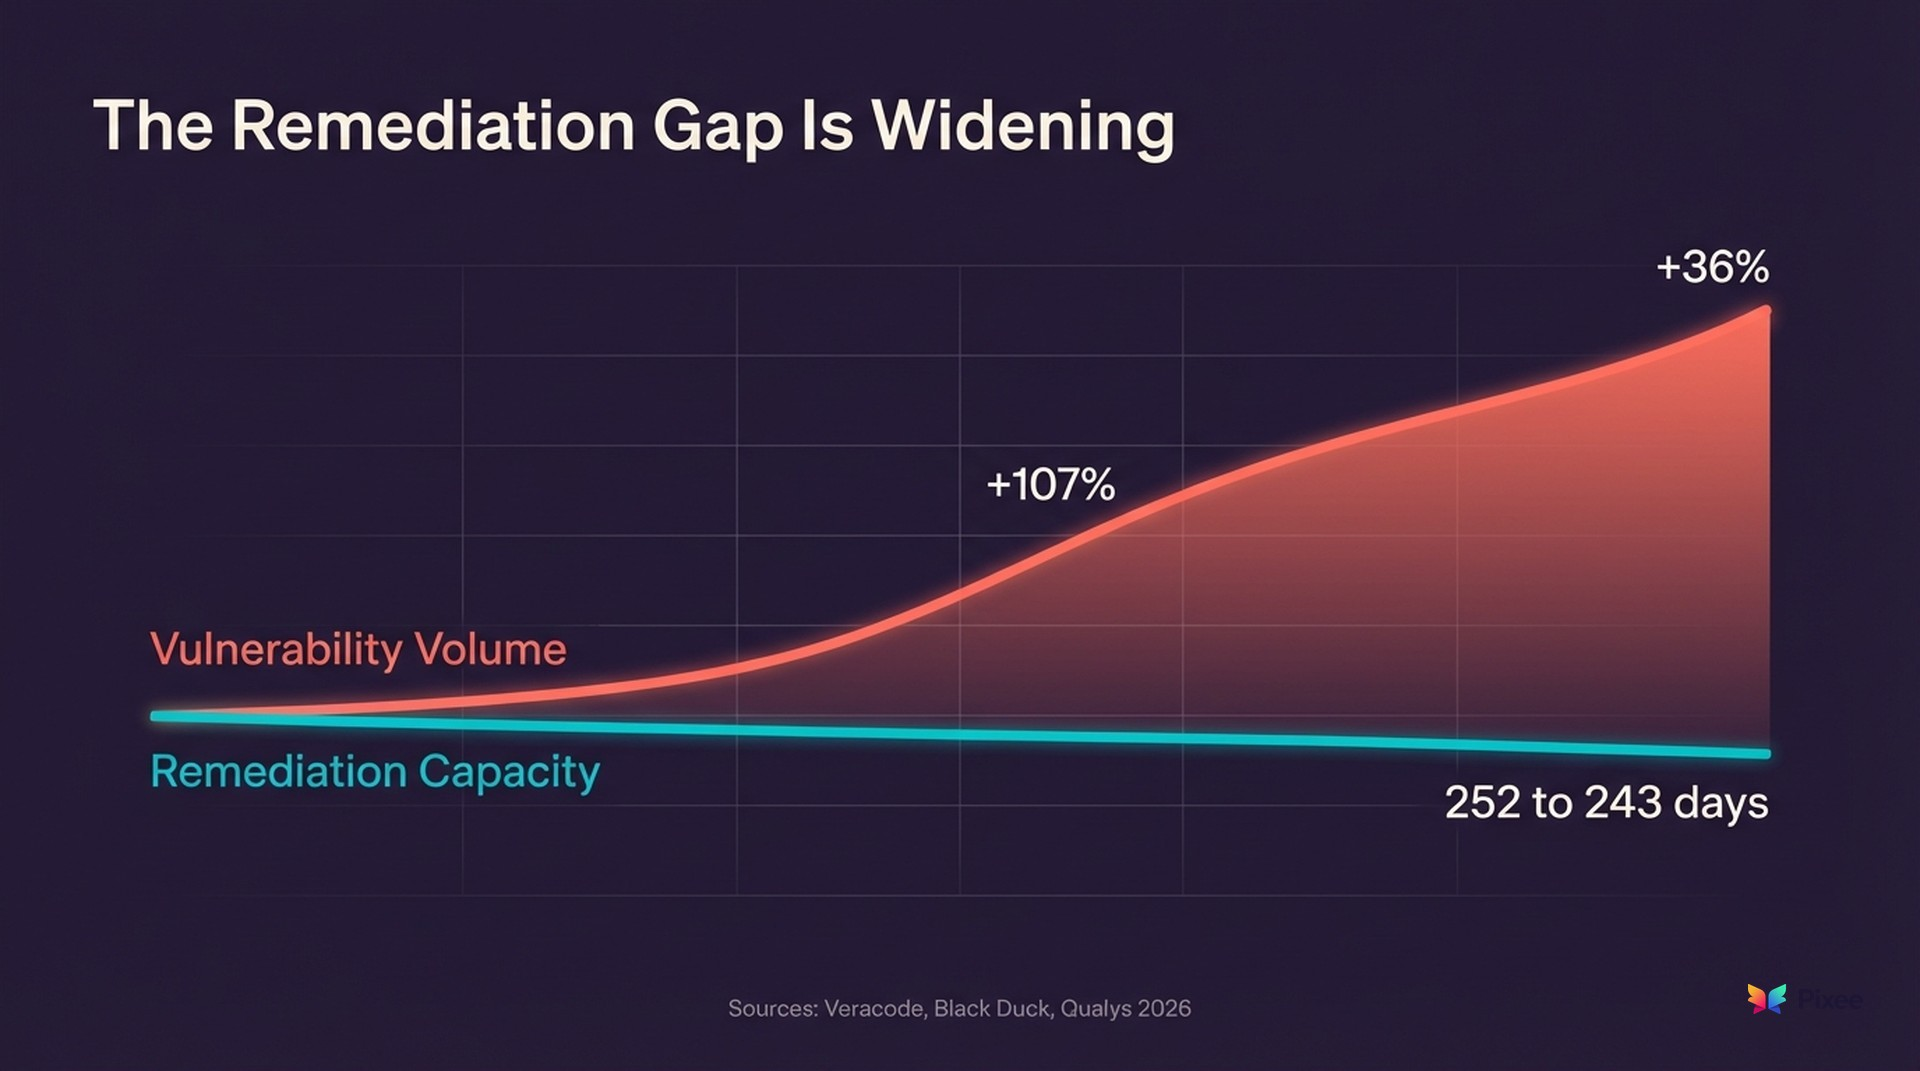
A year later, the picture has gotten worse. Veracode's 2026 follow-up found the half-life improved marginally to 243 days, but that modest gain is overwhelmed by surrounding trends: 82% of organizations now carry security debt (up from 74%), and high-severity exploitable flaws spiked 36% year-over-year. Qualys's 2026 analysis of over one billion remediation records across 10,000 organizations found that manual remediation failed to keep pace with attackers 88% of the time for actively weaponized vulnerabilities. Black Duck's 2026 OSSRA report found open source vulnerabilities per codebase doubled (+107% YoY), driven by AI-accelerated development.
And that number has been getting worse. It's up 47% from 171 days five years ago, and up 327% since Veracode first began tracking. In the public sector, it's even grimmer: government entities need an average of 315 days.
Your instinctive reaction is to speed up the fixing. Buy faster tools. Hire more developers. Automate pull requests.
But that diagnosis is wrong. That half-life isn't a speed problem. It's a triage problem. And until teams address the bottleneck upstream of remediation, no amount of faster fixing will move the number.
Meanwhile, the adversaries aren't waiting. Mandiant's M-Trends 2026 report, drawing on 500,000 hours of frontline incident investigations, found that the time from initial access to handoff between threat groups has collapsed from over 8 hours in 2022 to 22 seconds in 2025. Global median dwell time actually went up from 11 to 14 days (+27%), and Mandiant's data shows mean time to exploit is now -7 days -- meaning exploitation starts a full week before a patch is available. Organizations remediating in months face attackers who operate before day zero. That asymmetry defines the modern security environment.
What MTTR Actually Measures (and What It Misses)
Before going further, a disambiguation. "MTTR" in cybersecurity carries two distinct meanings. In vulnerability management, it measures the elapsed time from flaw detection to resolution. In incident response, it measures time from breach detection to containment (IBM's 2025 Cost of a Data Breach report puts that at 241 days on average). This guide focuses on vulnerability remediation MTTR, though the incident response context illustrates the same systemic challenge: defenders are structurally slower than attackers across every measurable dimension.
Mean Time to Remediate tracks the elapsed time between when a vulnerability is first detected and when it's confirmed resolved. Simple enough. But MTTR is a blunt instrument that obscures where time actually gets spent.
Break down the lifecycle of a typical vulnerability:
- Detection (minutes to hours) - A scanner flags the finding
- Triage (days to weeks) - An analyst evaluates whether the finding is real, exploitable, and worth fixing
- Prioritization (days to weeks) - The finding gets ranked against hundreds of others competing for developer attention
- Remediation (hours to days) - A developer writes and tests the fix
- Verification (hours) - The fix is confirmed and deployed
The actual coding work in step 4 is typically hours, not months. Even complex fixes rarely take more than a few days of focused development time. So where do the other 250 days go?
They go into steps 2 and 3. Triage and prioritization consume the vast majority of the elapsed time, and most of that time is wasted on findings that will never become real fixes.
And these averages mask significant variation. Edgescan's 2025 Vulnerability Statistics Report shows critical application and API vulnerabilities take a median of 74.3 days to remediate, while critical network vulnerabilities come in at 54.8 days. Industry matters too: software companies average 63 days; construction averages 104. Hadrian's 2026 Offensive Security Benchmark, drawing on data from 300+ global organizations, puts the average for high-severity vulnerabilities at 139 days. Bitsight's study of 1.4 million organizations found critical CISA Known Exploited Vulnerabilities take a median of 137 days -- more than nine times longer than the 15-day deadline CISA mandates. The Cyber Strategy Institute puts the median remediation half-life for internet-facing infrastructure even higher: 361 days overall, with healthcare at 519 days and education at 577.
Why MTTR Is Stuck (and Getting Worse)
The math explains the bottleneck.
Consider a mid-size enterprise AppSec program running five or six scanning tools across its application portfolio. A program like this typically generates somewhere between 1,500 and 3,000 findings per month. Industry research consistently reports false positive rates between 71% and 88% across static analysis, dynamic analysis, and SCA tools. A 2025 Ghost Security study scanning public GitHub repositories found SAST tools produced a 91% false positive rate on open-source code.
Take the midpoint: 80% false positives.
That means for every 2,000 findings, roughly 1,600 are noise. They're flagged vulnerabilities that either aren't exploitable in context, are already mitigated by existing security controls, or are duplicates surfaced by overlapping tools.
But someone still has to look at them. Every one of those 1,600 false positives requires an analyst to open the finding, review the code context, assess exploitability, check for compensating controls, and make a judgment call. Practitioner estimates put that process at 15 to 45 minutes per finding, depending on complexity.
Punishing arithmetic. At 30 minutes per finding, triaging 2,000 alerts consumes roughly 1,000 analyst-hours per month. For a team of four AppSec engineers working full time on triage, that's their entire capacity -- leaving zero hours for the strategic work they were hired to do.
The 400 real findings that survive triage then compete for developer time against feature work, tech debt, and other priorities. Most sit in a backlog queue for weeks or months before a developer picks them up. And 61% of developers say it's critical that security processes don't block or decelerate development (Help Net Security, 2025), so rigid "fix everything Critical in 30 days" mandates often produce zombie tickets -- issues that stay open forever, ignored until an audit forces a panic.
Qualys calls this the "broken physics of remediation." Their 2026 analysis found that 50% of critical vulnerabilities were weaponized before any patch existed, and non-standard assets (legacy systems, IoT, embedded devices) carry a 4-5x "long-tail tax" on remediation timelines. A single CVE (Follina) accumulated 33,000 exposure-days across their dataset. The Cyber Strategy Institute reports that 32.1% of exploited CVEs showed evidence of exploitation on or before disclosure day -- before defenders even knew the flaw existed.
This is how you get to nine-month remediation half-lives. Not because fixing is slow, but because the pipeline upstream of fixing is clogged with false positives, and the window between disclosure and exploitation has collapsed to zero or below.
The Compliance Gap Nobody Talks About
Regulators have set clear expectations for remediation timelines. Here's the reality check:
| Framework | Critical Requirement | High Requirement |
|---|---|---|
| CISA BOD 22-01 (KEV) | 15 days (internet-facing) | 25 days |
| PCI DSS 4.0 | 30 days | 30 days |
| FedRAMP | 30 days | 30 days |
| Common industry SLA | 24-72 hours | 30 days |
Now compare to actual performance. CISA mandates 15 days for critical KEVs; Bitsight found the median is 137 days. PCI DSS 4.0 requires 30 days for critical vulnerabilities; Veracode's flaw half-life exceeds eight months. High-severity KEVs take a median of 238 days -- nearly eight times the mandated deadline. And the CISA KEV catalog keeps growing: it hit 1,484 total entries in 2025, with 245 new additions that year alone (+20% growth) and 94 older CVEs retroactively marked as actively exploited.
Sixty percent of KEV vulnerabilities remain unaddressed past CISA deadlines. Only 5% of vulnerable enterprises fix their issues every month (Bitsight, 2024). Qualys found that only 15% of organizations had patched by the time a vulnerability hit the KEV catalog -- meaning 85% were exposed to known-exploited flaws with available fixes.
This isn't a marginal miss. It's an order-of-magnitude gap between what compliance requires and what organizations actually deliver. And the gap doesn't close by telling teams to work harder on the same broken process.
The Hidden Cost Beyond MTTR
The headline half-life number understates the real damage. MTTR only measures findings that eventually get resolved. It doesn't account for:
Findings that never get triaged at all. Ponemon Institute research found that organizations receive roughly 17,000 malware alerts per week, but only 19% are deemed reliable -- and of those reliable alerts, only 22.5% are investigated. That means roughly 4% of total alerts receive human attention. The Cyber Strategy Institute reports that 22% of organizations maintain 1,000+ open internet-facing vulnerabilities at any given time, with 130+ new CVEs issued daily. When the queue is 2,000 deep and growing, analysts start skipping findings entirely. Some of those skipped findings are real vulnerabilities sitting in production, unexamined.
The security debt spiral. Veracode's 2026 State of Software Security report puts a name to this accumulation: security debt -- known vulnerabilities left unresolved for over a year. Eighty-two percent of organizations now carry security debt, up 11% year over year. Sixty percent carry critical security debt: severe, exploitable flaws compounding risk every day they remain open, up 20% year over year.
The report also flagged a 36% year-over-year spike in vulnerabilities that are both severe and highly exploitable. Two-thirds of the most dangerous, longest-lived vulnerabilities come from third-party and open-source dependencies -- code teams don't control and can't easily patch.
Analyst attrition. Security engineers who spend 80% of their time reviewing false positives don't stay. They leave for roles where they can do actual security work. Ponemon estimates security teams spend 25% of their time chasing false positives, equating to roughly 1,300 hours per year and costing $1.4 million annually. The institutional knowledge analysts carry out the door compounds the problem for the team left behind.
Developer trust erosion. When eight out of ten findings sent to a developer turn out to be false positives, developers stop taking security findings seriously. The fix rate drops. The backlog grows. MTTR climbs further.
Where Teams Try to Fix MTTR (and Why It Doesn't Work)
Most MTTR reduction initiatives target the wrong part of the pipeline.
Approach 1: Hire more developers. Adding engineering capacity helps with step 4 (remediation), but the bottleneck is in steps 2-3 (triage). More developers waiting for triaged, prioritized findings doesn't reduce elapsed time.
Approach 2: Add more scanning tools. This makes the problem worse. Each new tool adds its own false positive stream. Teams running five or more tools on average are already drowning in overlapping, contradictory findings.
Approach 3: Implement SLA policies. Telling teams to fix critical vulnerabilities within 30 days doesn't address why findings sit in the triage queue for 200 days before anyone confirms they're critical. The SLA clock starts at detection; the human work starts much later. And as the compliance gap above shows, these SLAs are routinely missed by factors of 5x to 10x.
Approach 4: Prioritize by CVSS score alone. CVSS measures theoretical severity, not exploitability in your specific environment. A CVSS 9.8 finding behind three layers of network controls and input validation may be less urgent than a CVSS 6.5 finding that's directly reachable from the internet. Prioritizing by CVSS without context analysis still requires manual triage to validate.
And the numbers bear this out. Only 2.3% of CVEs scored CVSS 7+ were actually observed in exploitation attempts (Intruder, 2025). Hadrian's 2026 benchmark found an even starker number: only 0.47% of scanner findings were actually exploitable across 300+ organizations. The rest represent wasted prioritization effort -- teams burning cycles on theoretical risk while real exploits slip through.
EPSS v4, released March 2025, uses machine learning to predict exploitation probability and significantly outperforms CVSS for prioritization efficiency. Using an EPSS threshold of 10%, 96% of vulnerabilities below that threshold were neither exploited nor needed prioritization. The industry consensus is moving toward combining EPSS, CVSS, and the CISA KEV catalog: exploitation likelihood from EPSS, severity context from CVSS, and known active threats from KEV. Neither metric alone is sufficient, but together they eliminate most of the manual triage burden that CVSS-only approaches demand.
None of these approaches address the structural problem: too many findings require human evaluation, and most of those findings are false positives.
How Automation Breaks the Triage Bottleneck
The leverage point is between detection and remediation. Specifically, it's automated triage that can evaluate exploitability, reachability, and security control coverage without requiring an analyst to open every finding.
Automated triage works by analyzing each finding against its runtime context:
- Exploitability analysis. Is the vulnerable code path actually reachable? Can an attacker supply input that triggers the vulnerability?
- Security control detection. Are there existing controls (input validation, WAF rules, authentication gates) that mitigate the finding?
- Duplicate correlation. Are multiple tools flagging the same underlying issue? Consolidate to a single actionable finding.
- Environmental context. Is the affected component deployed in production? Is it internet-facing or internal-only?
When automated triage achieves a 95% false positive reduction — measured by comparing scanner-reported findings against exploitability-confirmed findings using reachability and control analysis (Pixee Platform Data, 2025) — the math changes dramatically.
Before automation: 2,000 findings per month, 80% false positives, 400 real issues buried under 1,600 noise alerts. Triage consumes 1,000 analyst-hours.
After automation: 2,000 findings scanned automatically. 1,900 dismissed or deprioritized with full evidence trails. 100 findings surfaced for human review, each pre-enriched with exploitability data and remediation context. Triage effort drops to roughly 50 analyst-hours.
OX Security's 2026 Application Security Benchmark validates this math at industry scale. Across 216 million findings from 250 organizations, only 0.092% were truly critical after applying exploitability and reachability analysis -- less than one in a thousand. The raw finding count is staggering; the actionable count is manageable. The difference between those two numbers is the triage automation opportunity.
That's 950 hours per month returned to the team for strategic security work, developer enablement, and architecture review.
From Triage to Remediation: Closing the Full Loop
Clearing the triage bottleneck is necessary but not sufficient. The validated findings still need fixes, and manual remediation has its own scaling limits.
Automated remediation generates context-aware code fixes that match the target repository's conventions, frameworks, and coding patterns. These fixes arrive as pull requests that developers can review and merge rather than writing from scratch.
Pixee's automated fixes achieve a 76% merge rate — defined as PRs merged without modification within 72 hours of opening, measured across 100,000+ PRs from enterprise deployments (Pixee Platform Data, 2025). Three out of four automated fixes are accepted by developers without modification, because they match the conventions the developer would have used.
The broader data supports this approach. IBM's 2025 Cost of a Data Breach report found that organizations using AI-powered security tools extensively cut their breach lifecycle by 80 days and saved $1.9 million on average (IBM measures breach lifecycle, not vulnerability MTTR, but the cost dynamics are similar). In vulnerability remediation specifically, Cymulate's 2025 benchmark reported MTTR reductions ranging from 40% to 87.5%, with the high end reflecting organizations that combined automated triage with automated remediation.
Combining automated triage with automated remediation compresses the full vulnerability lifecycle:
| Stage | Before Automation | After Automation |
|---|---|---|
| Triage | 80% of elapsed time | Minutes (automated) |
| Prioritization | Days-weeks in queue | Instant (risk-scored via EPSS + context) |
| Remediation | Hours-days per fix | Automated PR, developer review |
| Verification | Manual retest | CI/CD validation |
| Total MTTR | Months | Days to low weeks |
Implementation: What Changes When You Automate
Teams that move from manual to automated triage and remediation typically follow a three-phase rollout:
Phase 1: Unified visibility. Consolidate findings from all scanning tools into a single view. Most teams run between four and seven tools, each with its own dashboard and severity scale. Before automating triage decisions, you need a single source of truth across all scanners. This is also the phase to establish your prioritization model -- combining EPSS scores, CVSS context, and KEV catalog status rather than relying on any single severity metric.
Phase 2: Automated triage. Deploy exploitability analysis against the consolidated finding stream. Start with the highest-volume scanners first (typically SAST and SCA, which generate the most false positives). Measure the false positive reduction rate and validate against manual triage decisions on a sample set. Teams should expect the actionable finding count to drop dramatically -- recall OX Security's benchmark: 216 million findings, 0.092% truly critical.
Phase 3: Automated remediation. Once triage is producing a clean, prioritized backlog, enable automated fix generation for the finding types that have well-understood remediation patterns. Monitor merge rates as the quality signal. If developers aren't accepting fixes, the automation needs refinement.
Order matters. Automating remediation before triage just generates fixes faster for findings that might be false positives. The bottleneck has to clear from left to right.
Measuring What Matters Beyond MTTR
MTTR is a useful headline metric, but teams with mature automation track additional signals:
- Triage throughput. Findings processed per analyst-hour. This measures whether automation is actually reducing the manual burden.
- False positive rate by scanner. Which tools generate the most noise? This informs tool consolidation decisions.
- Merge rate. What percentage of automated fixes are accepted by developers? This measures remediation quality.
- Backlog velocity. Is the total open finding count shrinking, stable, or growing? MTTR can improve while the backlog grows if new findings arrive faster than old ones close.
- Time to human review. How quickly do validated findings reach an analyst for final assessment? This replaces MTTR as the more precise measure of triage efficiency.
- Security debt ratio. What percentage of open findings have been unresolved for over a year? This is Veracode's "security debt" metric, and it's gaining traction as a board-level indicator because it captures the compounding nature of unfixed vulnerabilities in language executives understand.
- Average Window of Exposure. Qualys's 2026 report argues this metric should replace MTTR entirely. It measures total exposure-days across an organization's attack surface, accounting for asset count and time unpatched. Where MTTR can look acceptable while thousands of assets sit exposed, AWE captures cumulative risk in a single number.
For board reporting, keep dashboards to six to eight metrics presented as trends over time. MTTR alone can mislead -- pair it with backlog velocity and security debt ratio to give leadership a complete picture.
Example: 200-developer org with 5 scanners. Assume 500 new findings/month, 70% false positives after triage, 30-minute average manual triage time, and $75/hour fully-loaded analyst cost. Manual triage alone costs ~$131K/year (500 x 12 x 0.5hr x $75 x 0.7 wasted on false positives). Reducing false positives by 90% through automated triage recovers ~$118K/year in analyst time — before counting remediation speed improvements.
The Real MTTR Problem, Restated
A 252-day flaw half-life is a symptom. Underneath it sits a triage process designed for hundreds of findings being asked to handle thousands, most of which are false positives. Meanwhile, Veracode's 2026 data shows 82% of organizations carrying security debt that grows heavier each quarter, Mandiant's data shows adversaries exploiting flaws a week before patches exist, and Qualys found manual remediation losing the race to attackers 88% of the time.
Faster fixing doesn't help when the finding hasn't been triaged. More tools don't help when each tool adds to the noise. More analysts don't help when most of their time goes to reviewing findings that aren't real. And compliance mandates don't help when the gap between required timelines and actual performance is measured in multiples, not percentages.
Meaningful MTTR reduction runs through automated triage first, automated remediation second, and continuous measurement throughout. Teams that address the bottleneck in the right order see MTTR compress from months to days. Not because they fix faster, but because they stopped wasting time on findings that never needed fixing.
Start by measuring your current remediation half-life across severity levels. If you do not have that number, you cannot improve it.
Related Reading: